 5
5peptides
spectra

0.000 | 0.034
0.000 | 0.000
0.093 | 0.229
0.000 | 0.061
0.049 | 0.259
0.244 | 0.480
0.213 | 0.316
0.000 | 0.023
| Plot | Mito | Lyso | Perox | ER | Golgi | PM | Cytosol | Nucleus | |||||
| Expt A |
5 peptides |
7 spectra |
|
0.000 0.000 | 0.034 |
0.000 0.000 | 0.000 |
0.170 0.093 | 0.229 |
0.000 0.000 | 0.061 |
0.174 0.049 | 0.259 |
0.380 0.244 | 0.480 |
0.274 0.213 | 0.316 |
0.002 0.000 | 0.023 |
| 2 spectra, SVVGTPAYLAPEVLR | 0.000 | 0.000 | 0.000 | 0.000 | 0.055 | 0.511 | 0.435 | 0.000 | ||
| 1 spectrum, LCDFGFAR | 0.000 | 0.190 | 0.000 | 0.000 | 0.000 | 0.506 | 0.304 | 0.000 | ||
| 2 spectra, IPNNCSGVR | 0.000 | 0.000 | 0.000 | 0.256 | 0.107 | 0.348 | 0.289 | 0.000 | ||
| 1 spectrum, GLDDSEEPSPPEDK | 0.266 | 0.000 | 0.082 | 0.000 | 0.219 | 0.267 | 0.166 | 0.000 | ||
| 1 spectrum, DLVCSIVYQK | 0.219 | 0.000 | 0.453 | 0.000 | 0.301 | 0.000 | 0.027 | 0.000 |
| Plot | Lyso | Other | |||||||||||
| Expt C |
4 peptides |
8 spectra |
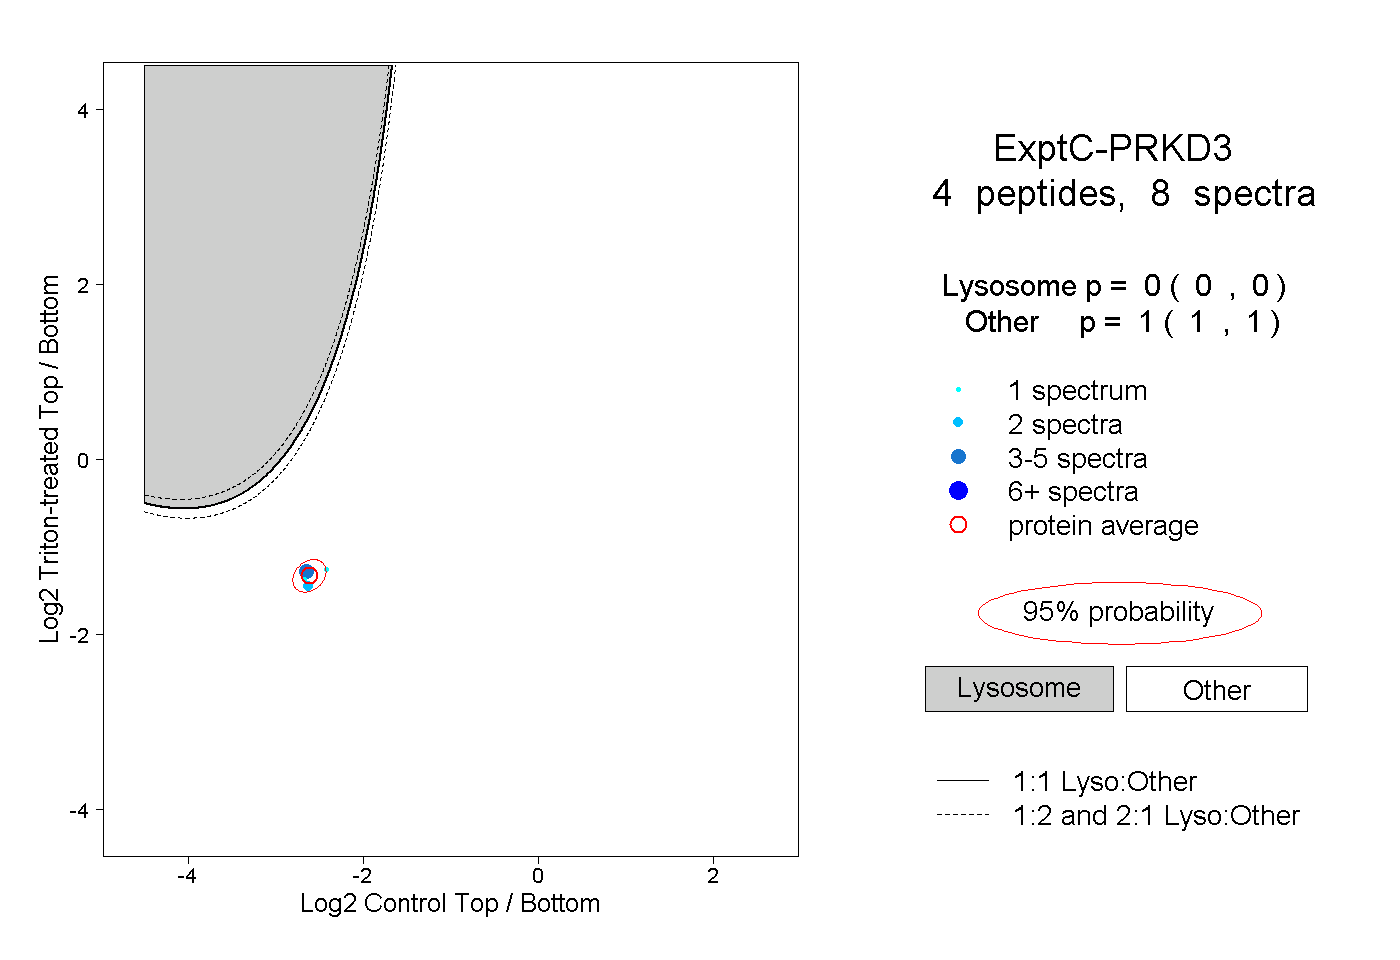 |
0.000 0.000 | 0.000 |
1.000 1.000 | 1.000 |