 2
2peptides
spectra
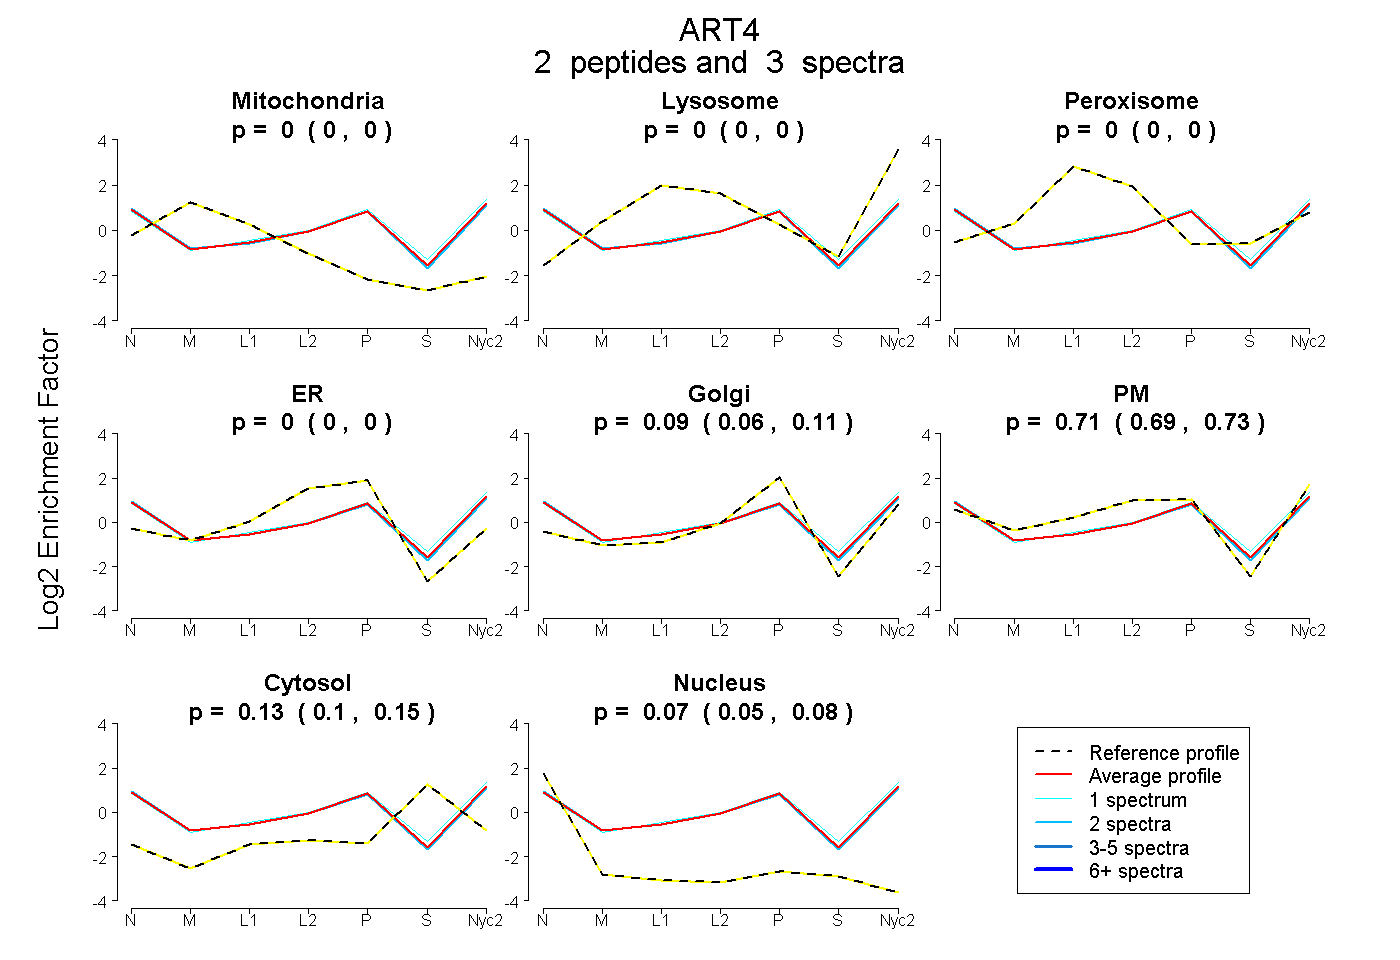
0.000 | 0.000
0.000 | 0.000
0.000 | 0.000
0.000 | 0.000
0.064 | 0.109
0.689 | 0.729
0.103 | 0.153
0.055 | 0.082
| Plot | Mito | Lyso | Perox | ER | Golgi | PM | Cytosol | Nucleus | |||||
| Expt A |
2 peptides |
3 spectra |
|
0.000 0.000 | 0.000 |
0.000 0.000 | 0.000 |
0.000 0.000 | 0.000 |
0.000 0.000 | 0.000 |
0.087 0.064 | 0.109 |
0.712 0.689 | 0.729 |
0.131 0.103 | 0.153 |
0.070 0.055 | 0.082 |
| 2 spectra, QVLEELNQGDYFVR | 0.000 | 0.000 | 0.000 | 0.000 | 0.093 | 0.710 | 0.103 | 0.094 | ||
| 1 spectrum, EVLIPPYELFEVVSK | 0.000 | 0.000 | 0.000 | 0.000 | 0.075 | 0.717 | 0.186 | 0.022 |
| Plot | Lyso | Other | |||||||||||
| Expt C |
2 peptides |
6 spectra |
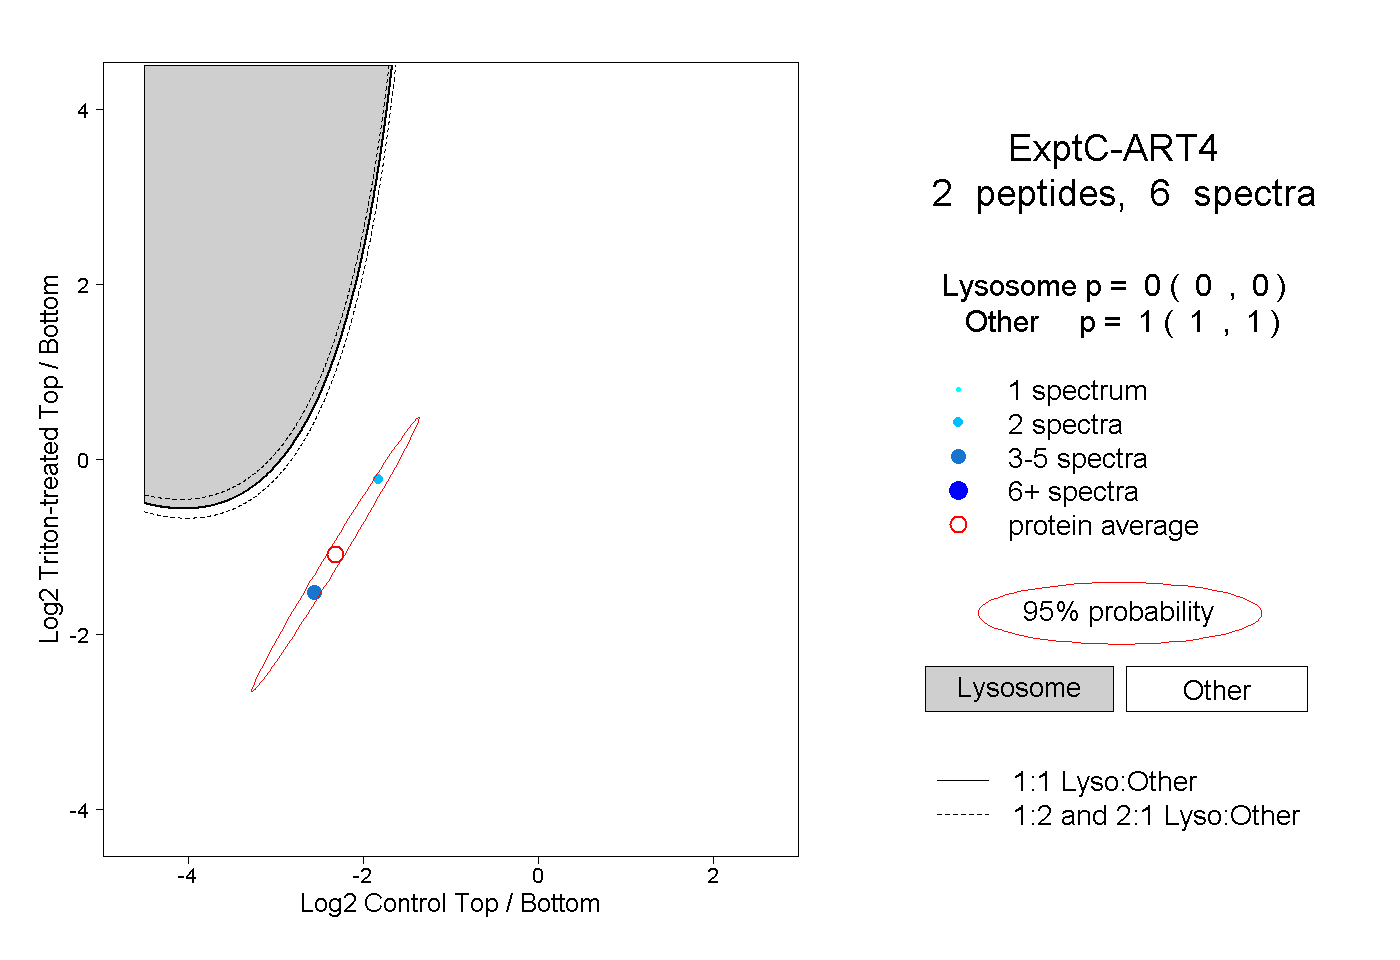 |
0.000 0.000 | 0.000 |
1.000 1.000 | 1.000 |