DERL1
[ENSRNOP00000007484]
Main page
| | | Plot |
Mito |
Lyso |
|
Perox |
ER |
Golgi |
PM |
Cytosol |
Nucleus |
|
| Expt A |
 6
6
peptides |
27
spectra |
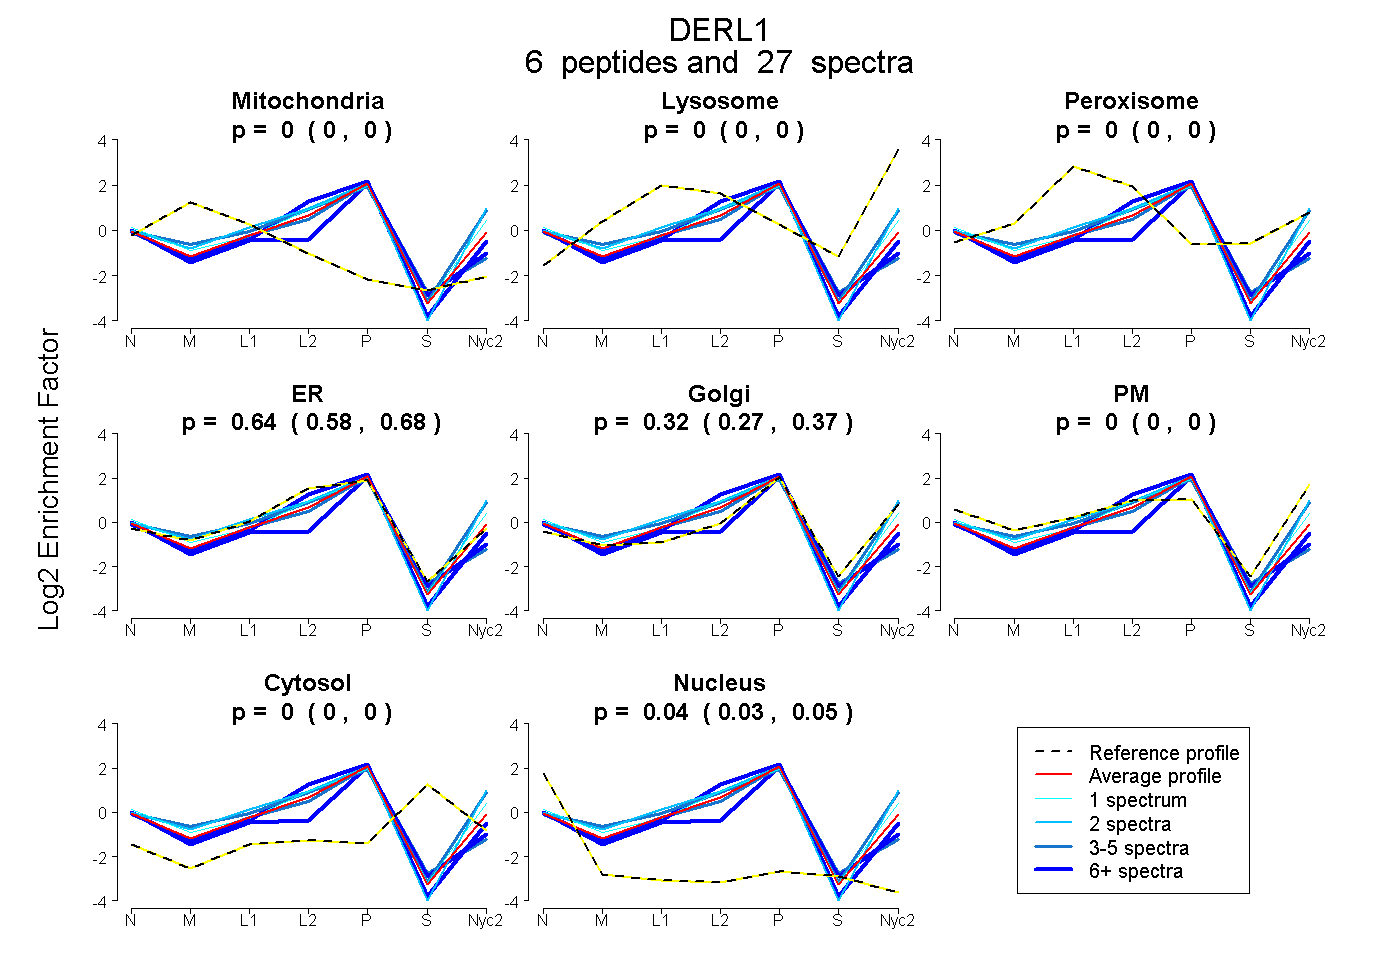 |
0.000
0.000 | 0.000 |
0.000
0.000 | 0.000 |
|
0.000
0.000 | 0.000 |
0.637
0.584 | 0.677 |
0.323
0.267 | 0.368 |
0.000
0.000 | 0.000 |
0.000
0.000 | 0.000 |
0.040
0.027 | 0.050 |
|
| | | Plot |
Mito |
|
Lyso or Perox |
|
ER |
Golgi |
PM |
Cytosol |
Nucleus |
|
| Expt B |
3
peptides |
10
spectra |
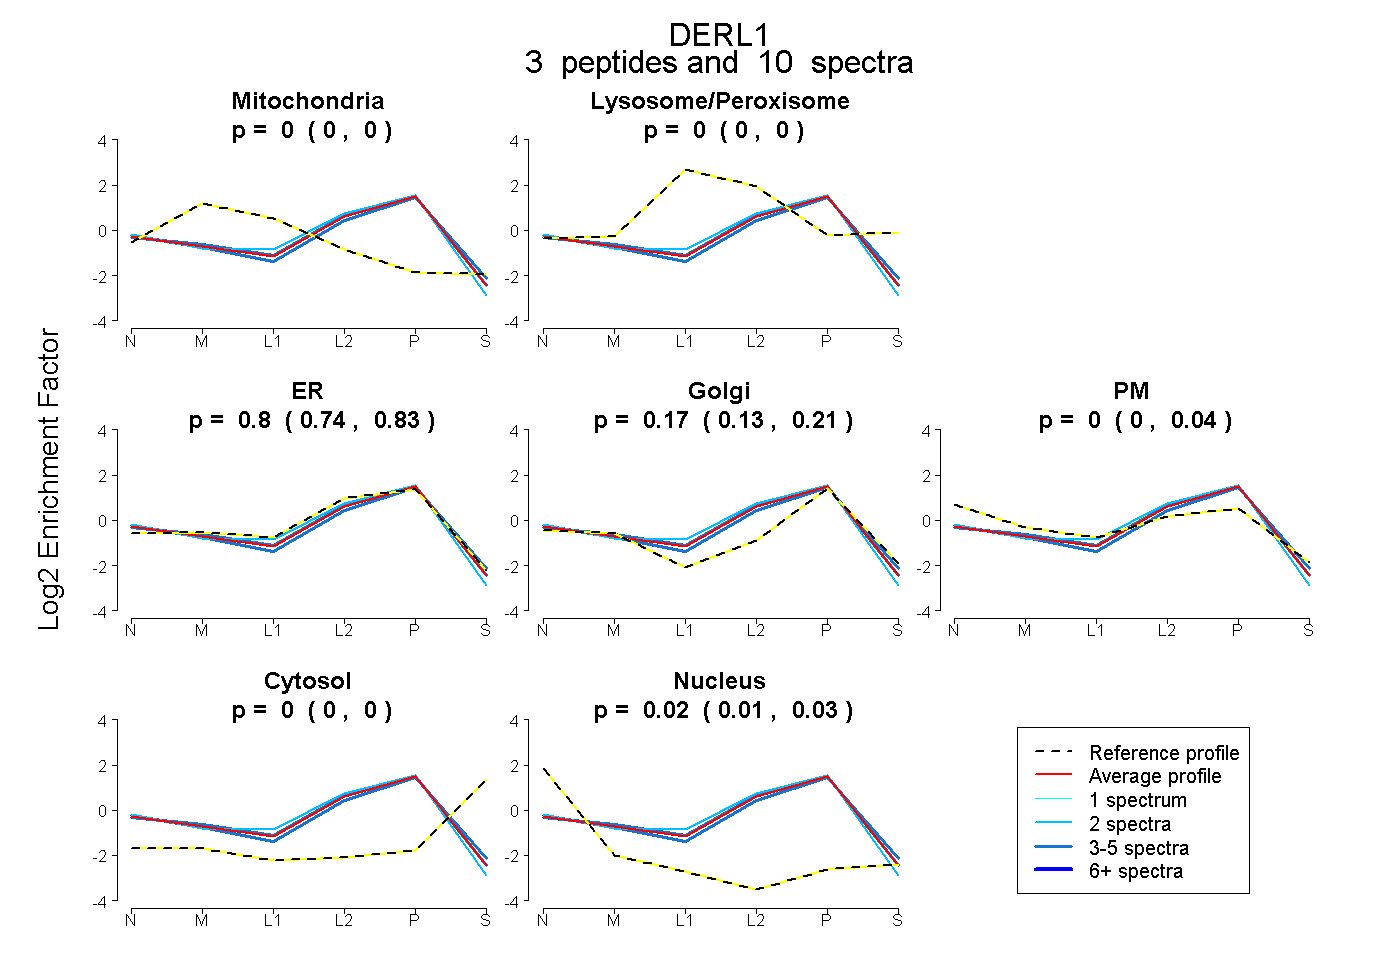 |
0.000
0.000 | 0.000 |
|
0.000
0.000 | 0.000 |
|
0.804
0.743 | 0.829 |
0.172
0.134 | 0.208 |
0.000
0.000 | 0.043 |
0.000
0.000 | 0.000 |
0.025
0.007 | 0.031 |
|
| 4 spectra, HNWGQGFR |
0.000 |
|
0.000 |
|
0.612 |
0.327 |
0.052 |
0.000 |
0.009 |
|
| 2 spectra, SIPAITR |
0.000 |
|
0.000 |
|
0.959 |
0.000 |
0.000 |
0.000 |
0.041 |
|
| 4 spectra, NFLSTPQFLYR |
0.000 |
|
0.000 |
|
0.826 |
0.160 |
0.000 |
0.000 |
0.014 |
|
| | | Plot |
|
Lyso |
|
|
|
|
|
|
|
Other |
| Expt C |
5
peptides |
22
spectra |
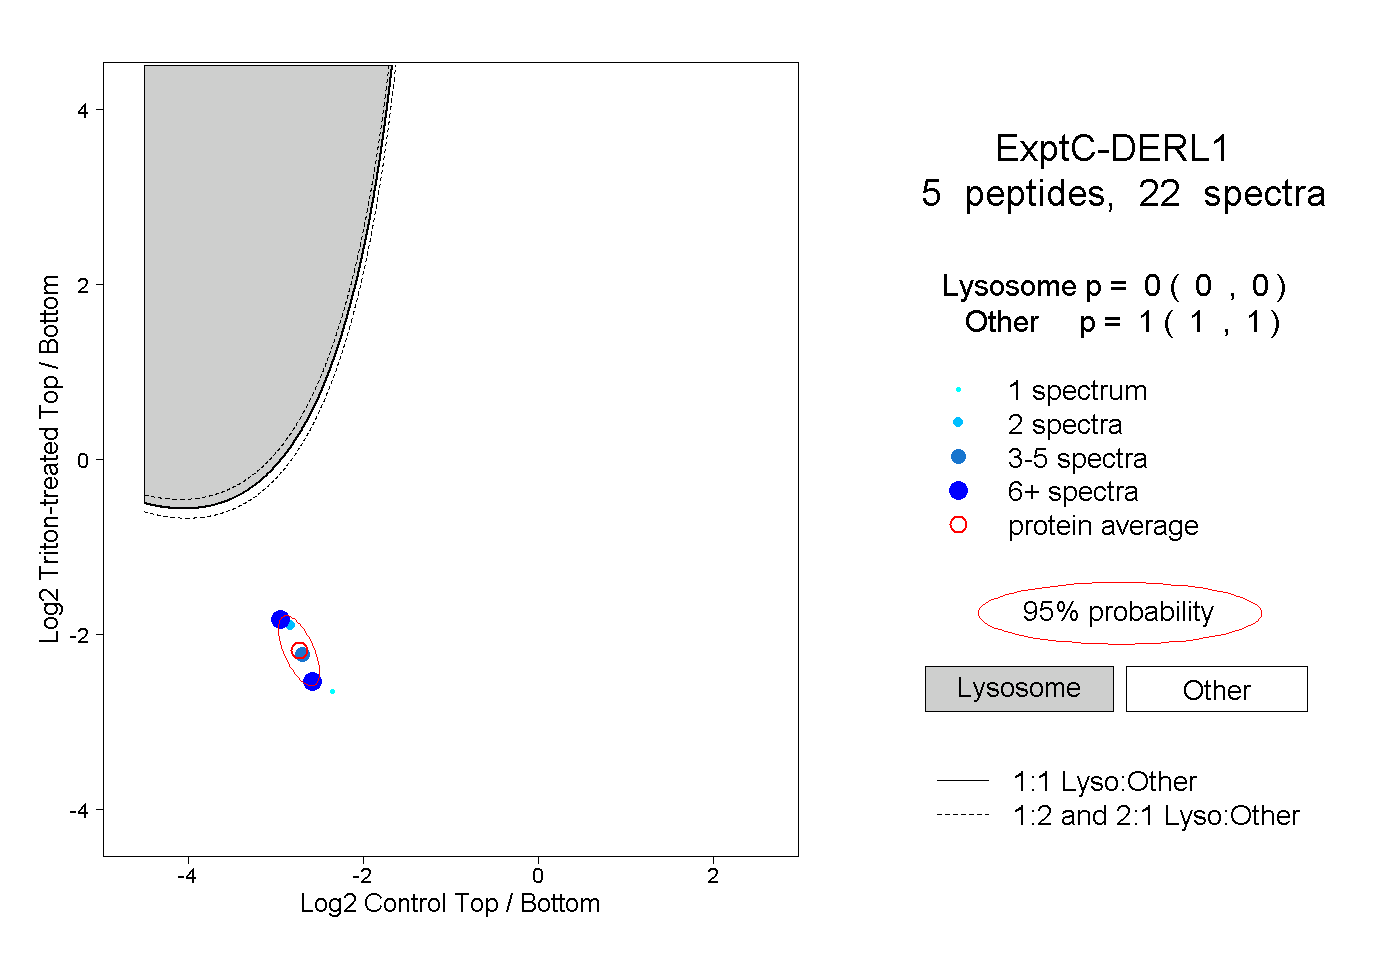 |
|
0.000
0.000 | 0.000 |
|
|
|
|
|
|
|
1.000
1.000 | 1.000 |
| | | Plot |
|
Lyso |
|
|
|
|
|
|
|
Other |
| Expt D |
4
peptides |
6
spectra |
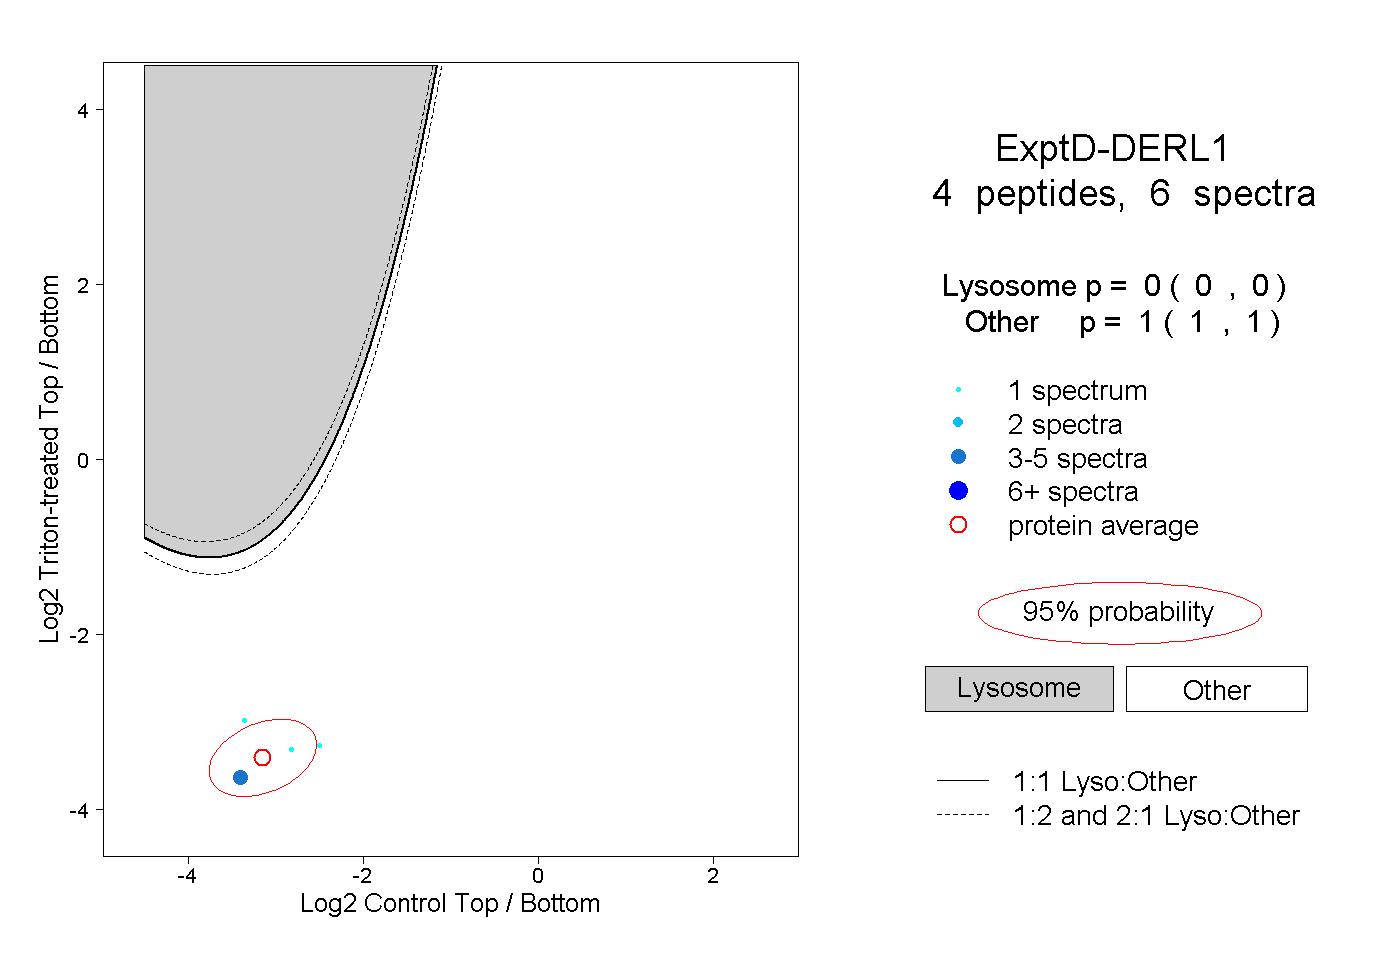 |
|
0.000
0.000 | 0.000 |
|
|
|
|
|
|
|
1.000
1.000 | 1.000 |