 3
3peptides
spectra
0.000 | 0.035
0.000 | 0.000
0.000 | 0.090
0.256 | 0.379
0.000 | 0.015
0.000 | 0.003
0.552 | 0.663
0.000 | 0.053
2peptides
spectra
NA | NA
NA | NA
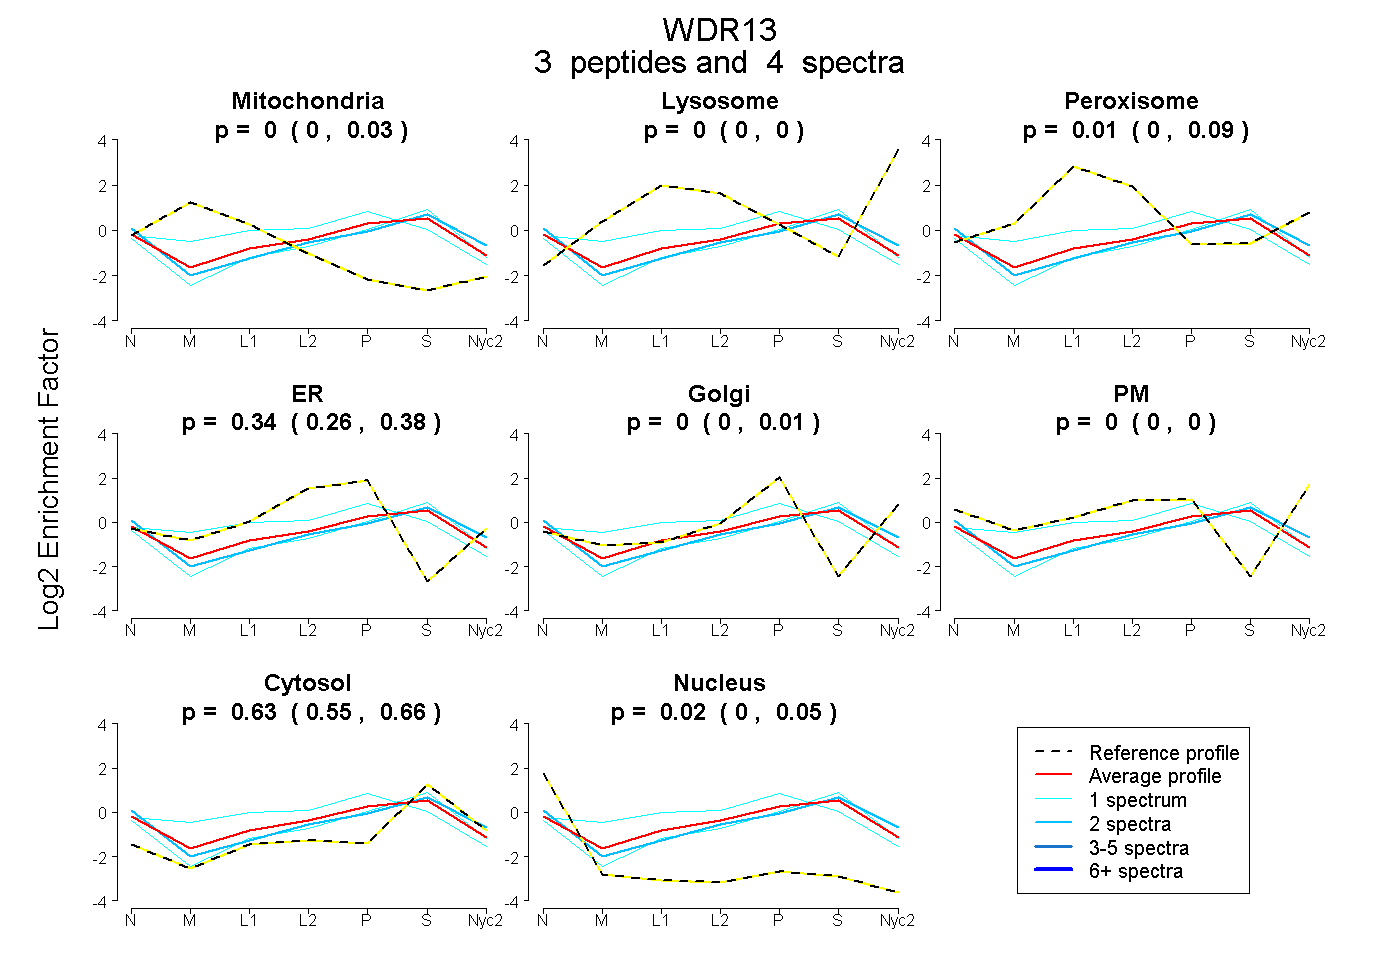
| Plot | Mito | Lyso | Perox | ER | Golgi | PM | Cytosol | Nucleus | |||||
| Expt A |
3 peptides |
4 spectra |
|
0.000 0.000 | 0.035 |
0.000 0.000 | 0.000 |
0.011 0.000 | 0.090 |
0.344 0.256 | 0.379 |
0.000 0.000 | 0.015 |
0.000 0.000 | 0.003 |
0.626 0.552 | 0.663 |
0.019 0.000 | 0.053 |
||
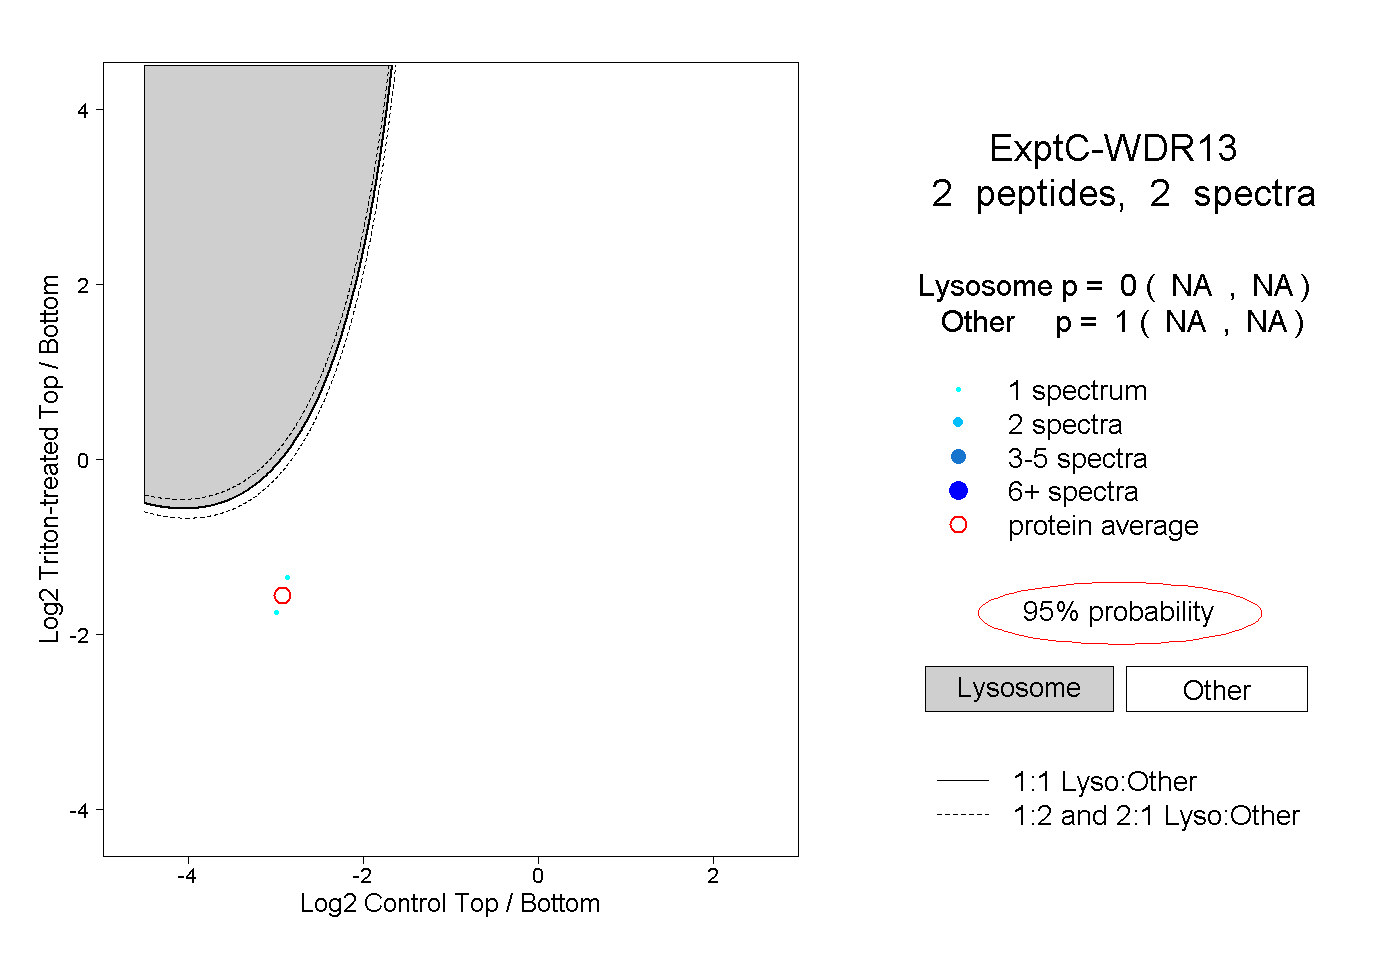
| Plot | Lyso | Other | |||||||||||
| Expt C |
2 peptides |
2 spectra |
|
0.000 NA | NA |
1.000 NA | NA |