 2
2peptides
spectra
0.014 | 0.277
0.000 | 0.000
0.000 | 0.025
0.000 | 0.530
0.000 | 0.000
0.184 | 0.858
0.000 | 0.000
0.000 | 0.016
3peptides
spectra
0.000 | 0.006
0.994 | 1.000
| Plot | Mito | Lyso | Perox | ER | Golgi | PM | Cytosol | Nucleus | |||||
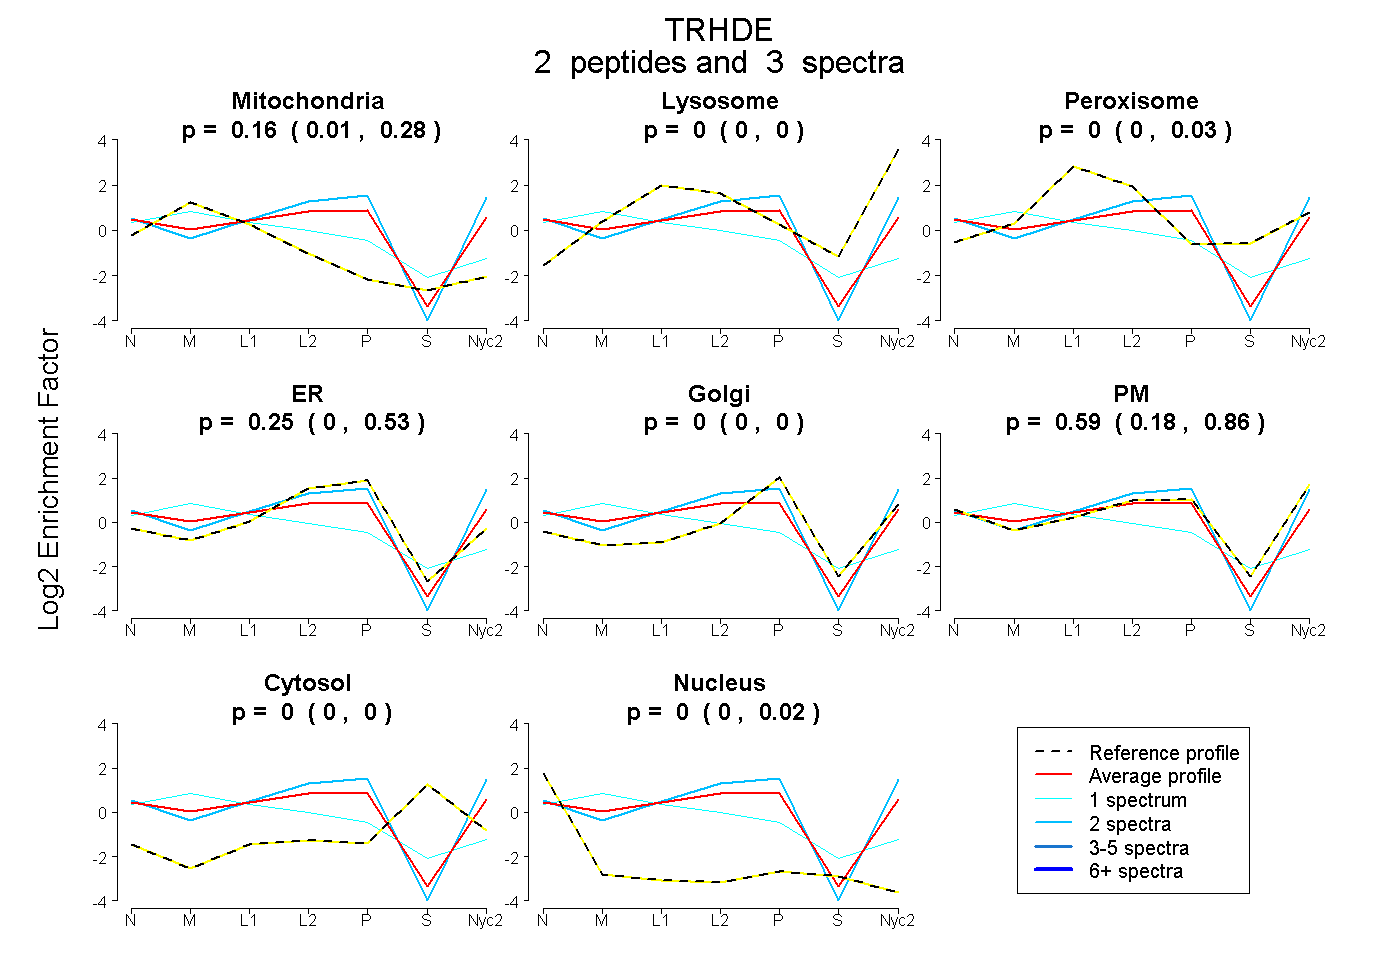
| Expt A |
2 peptides |
3 spectra |
|
0.164 0.014 | 0.277 |
0.000 0.000 | 0.000 |
0.000 0.000 | 0.025 |
0.251 0.000 | 0.530 |
0.000 0.000 | 0.000 |
0.586 0.184 | 0.858 |
0.000 0.000 | 0.000 |
0.000 0.000 | 0.016 |
||
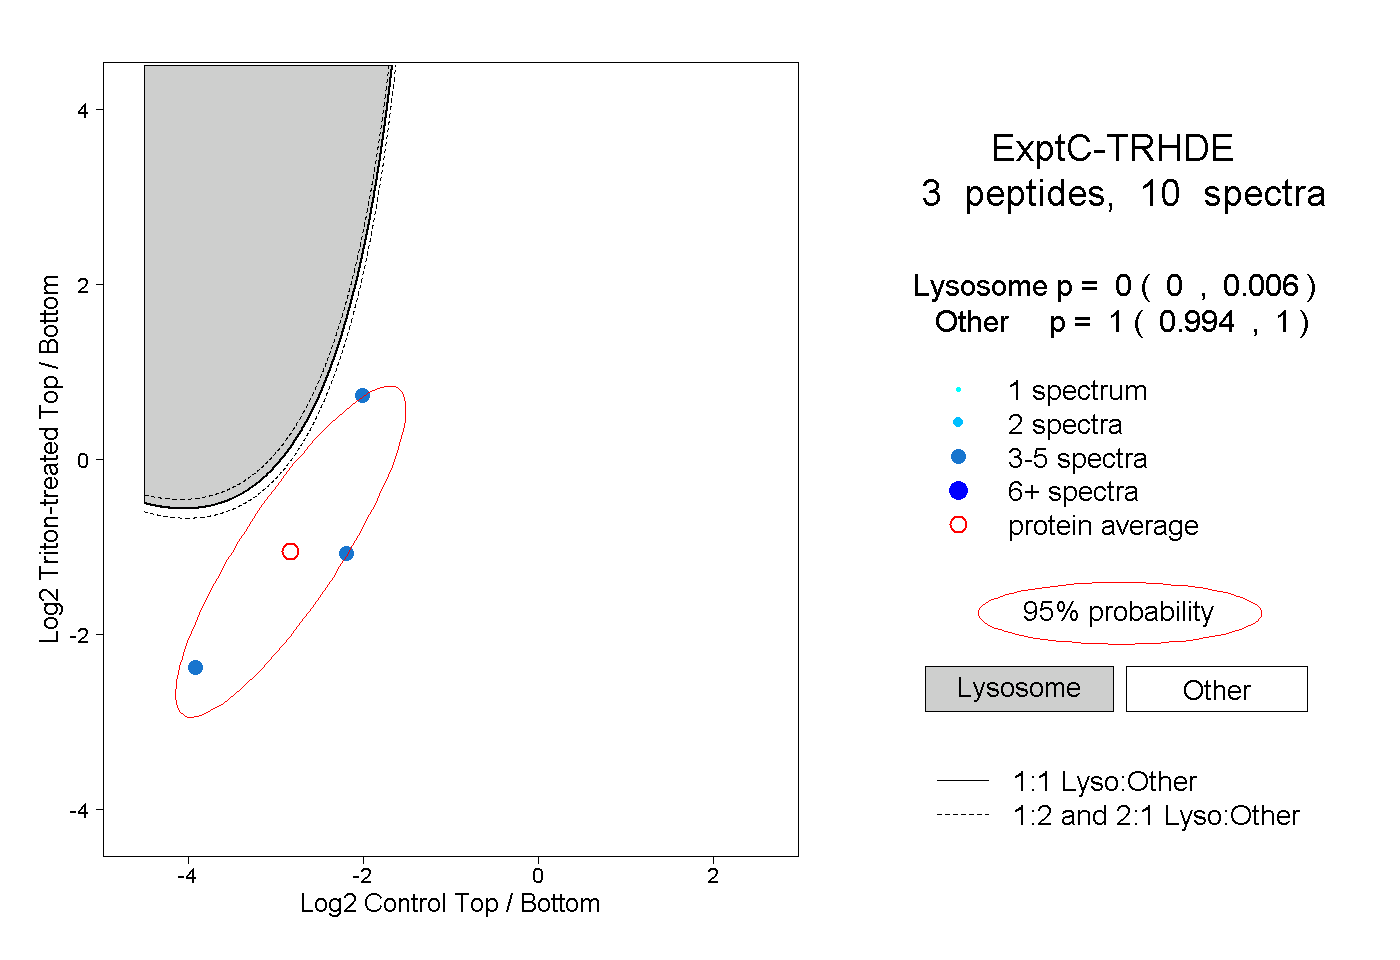
| Plot | Lyso | Other | |||||||||||
| Expt C |
3 peptides |
10 spectra |
|
0.000 0.000 | 0.006 |
1.000 0.994 | 1.000 |