8
8peptides
spectra
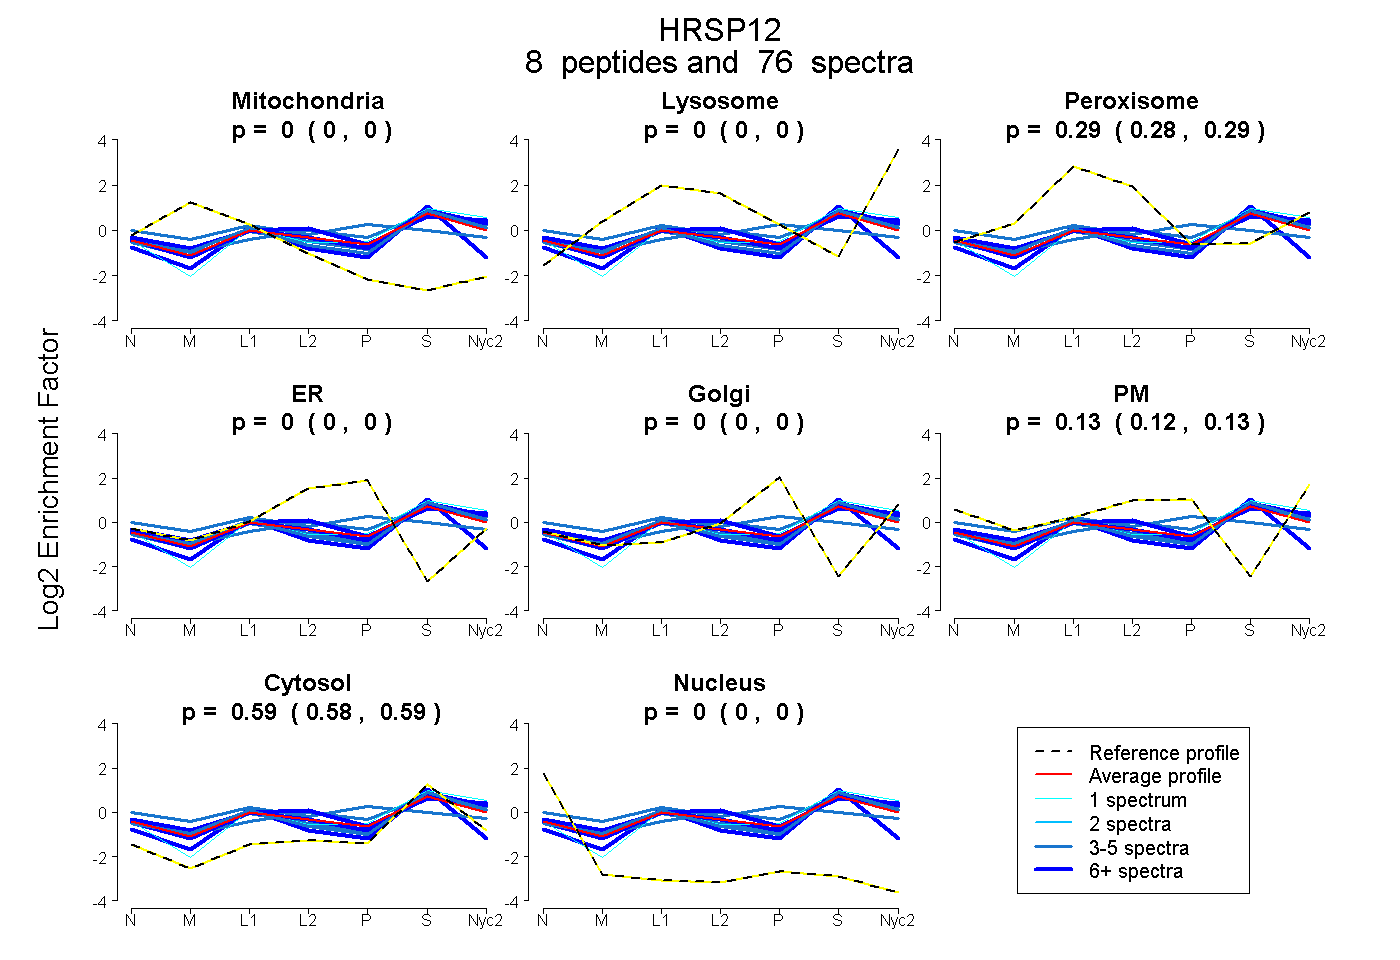
0.000 | 0.000
0.000 | 0.000
0.282 | 0.293
0.000 | 0.000
0.000 | 0.000
0.117 | 0.131
0.582 | 0.591
0.000 | 0.000
8peptides
spectra
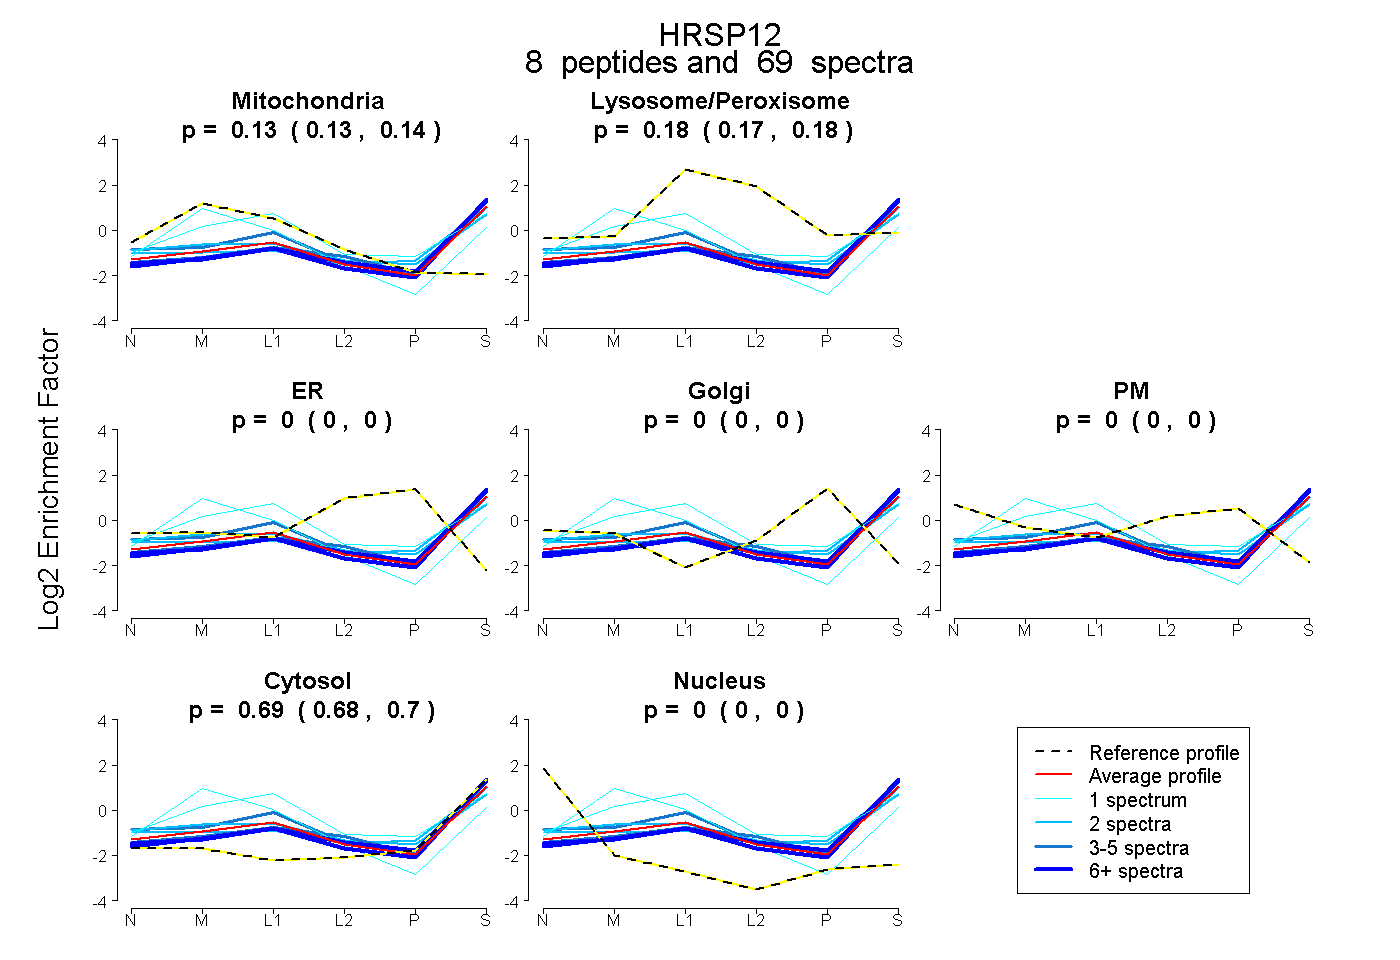
0.126 | 0.142
0.169 | 0.181
0.000 | 0.000
0.000 | 0.000
0.000 | 0.000
0.684 | 0.696
0.000 | 0.000