 8
8peptides
spectra
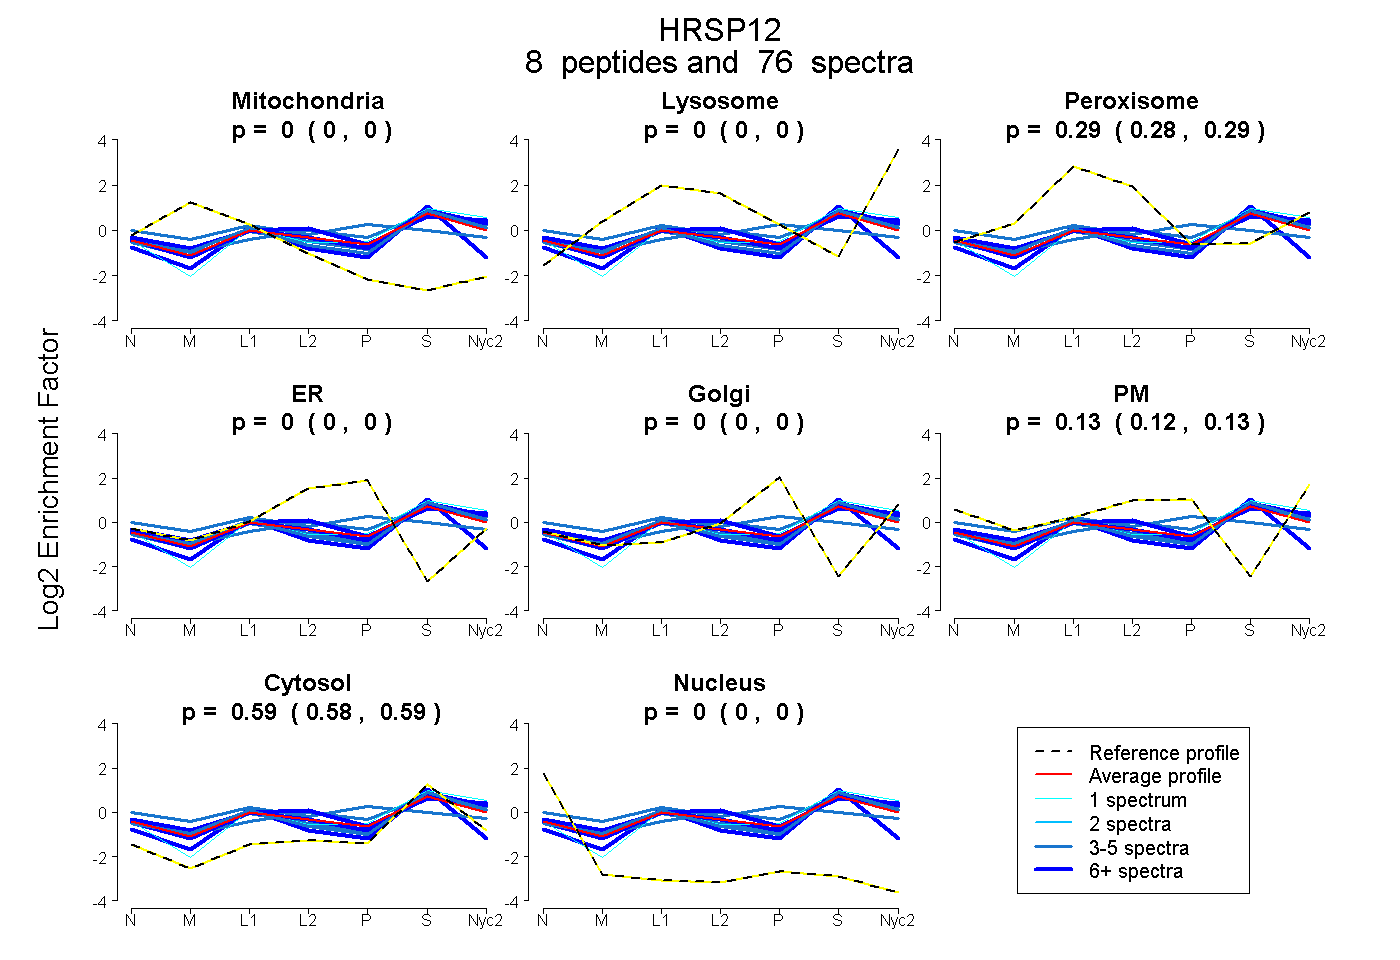
0.000 | 0.000
0.000 | 0.000
0.282 | 0.293
0.000 | 0.000
0.000 | 0.000
0.117 | 0.131
0.582 | 0.591
0.000 | 0.000
| Plot | Mito | Lyso | Perox | ER | Golgi | PM | Cytosol | Nucleus | |||||
| Expt A |
8 peptides |
76 spectra |
|
0.000 0.000 | 0.000 |
0.000 0.000 | 0.000 |
0.288 0.282 | 0.293 |
0.000 0.000 | 0.000 |
0.000 0.000 | 0.000 |
0.125 0.117 | 0.131 |
0.587 0.582 | 0.591 |
0.000 0.000 | 0.000 |
| 5 spectra, AAYQVAALPK | 0.000 | 0.016 | 0.205 | 0.000 | 0.000 | 0.219 | 0.560 | 0.000 | ||
| 5 spectra, IEIEAIAVQGPFTTAGL | 0.087 | 0.000 | 0.315 | 0.000 | 0.275 | 0.000 | 0.318 | 0.005 | ||
| 4 spectra, APAAIGAYSQAVLVDR | 0.000 | 0.011 | 0.285 | 0.000 | 0.000 | 0.077 | 0.627 | 0.000 | ||
| 12 spectra, AAGCDFTNVVK | 0.043 | 0.000 | 0.237 | 0.000 | 0.000 | 0.000 | 0.689 | 0.031 | ||
| 3 spectra, VLSTSK | 0.043 | 0.062 | 0.275 | 0.000 | 0.000 | 0.015 | 0.605 | 0.000 | ||
| 7 spectra, NLGEILK | 0.000 | 0.052 | 0.260 | 0.000 | 0.000 | 0.089 | 0.598 | 0.000 | ||
| 1 spectrum, TTVLLADINDFGTVNEIYK | 0.000 | 0.118 | 0.134 | 0.000 | 0.000 | 0.102 | 0.646 | 0.000 | ||
| 39 spectra, TYFQGNLPAR | 0.000 | 0.028 | 0.296 | 0.000 | 0.000 | 0.171 | 0.506 | 0.000 |
| Plot | Mito | Lyso or Perox | ER | Golgi | PM | Cytosol | Nucleus | ||||||
| Expt B |
8 peptides |
69 spectra |
 |
0.134 0.126 | 0.142 |
0.175 0.169 | 0.181 |
0.000 0.000 | 0.000 |
0.000 0.000 | 0.000 |
0.000 0.000 | 0.000 |
0.690 0.684 | 0.696 |
0.000 0.000 | 0.000 |
|||
| Plot | Lyso | Other | |||||||||||
| Expt C |
9 peptides |
403 spectra |
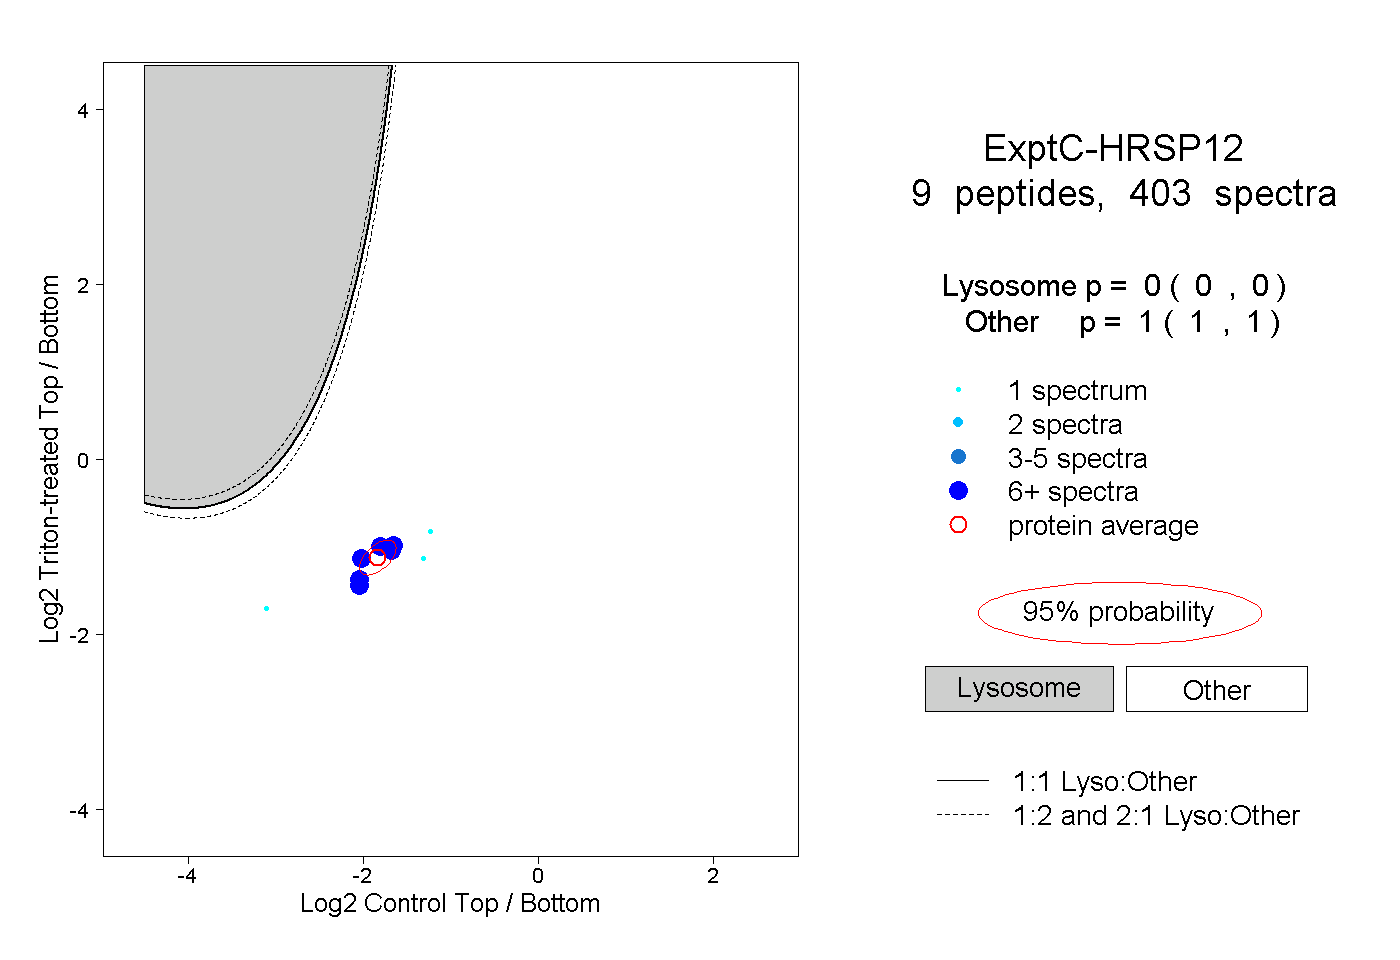 |
0.000 0.000 | 0.000 |
1.000 1.000 | 1.000 |
||||||||
| Plot | Lyso | Other | |||||||||||
| Expt D |
5 peptides |
44 spectra |
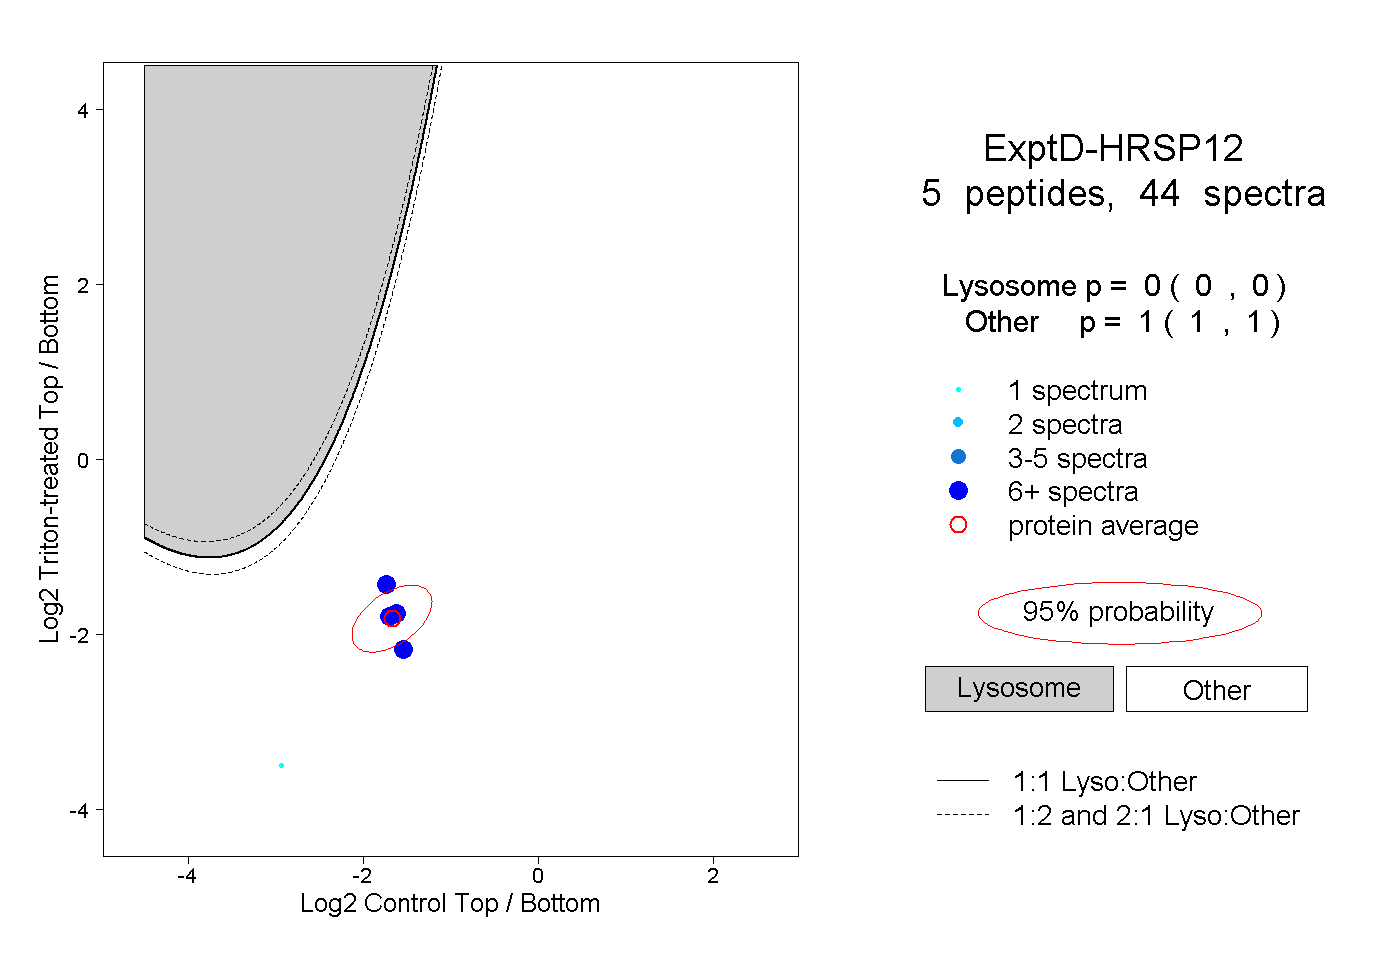 |
0.000 0.000 | 0.000 |
1.000 1.000 | 1.000 |