 3
3peptides
spectra
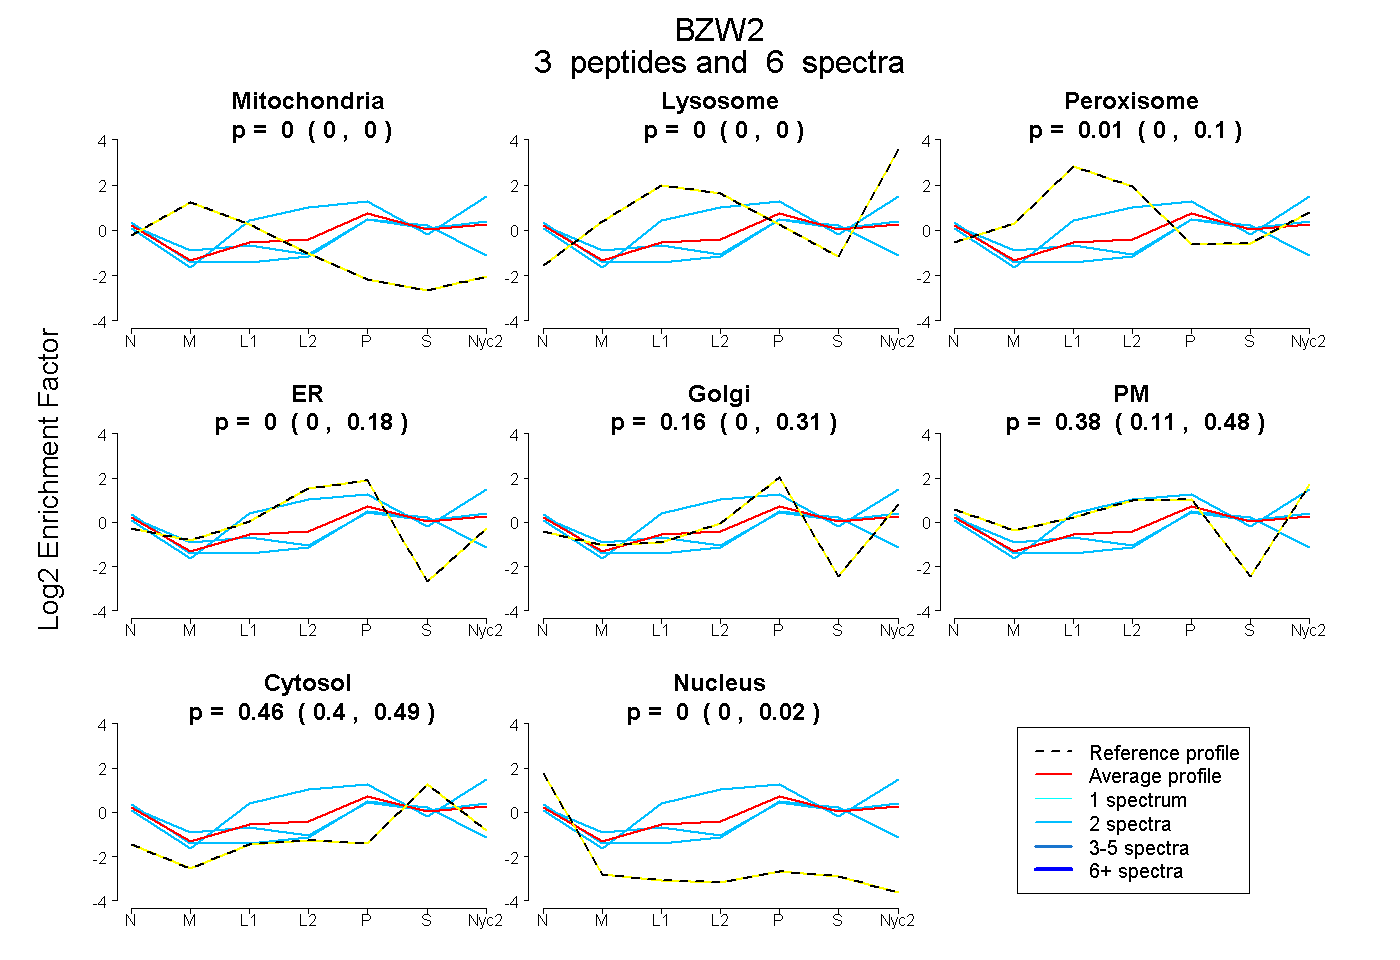
0.000 | 0.000
0.000 | 0.000
0.000 | 0.100
0.000 | 0.182
0.000 | 0.307
0.105 | 0.484
0.396 | 0.487
0.000 | 0.015
2peptides
spectra
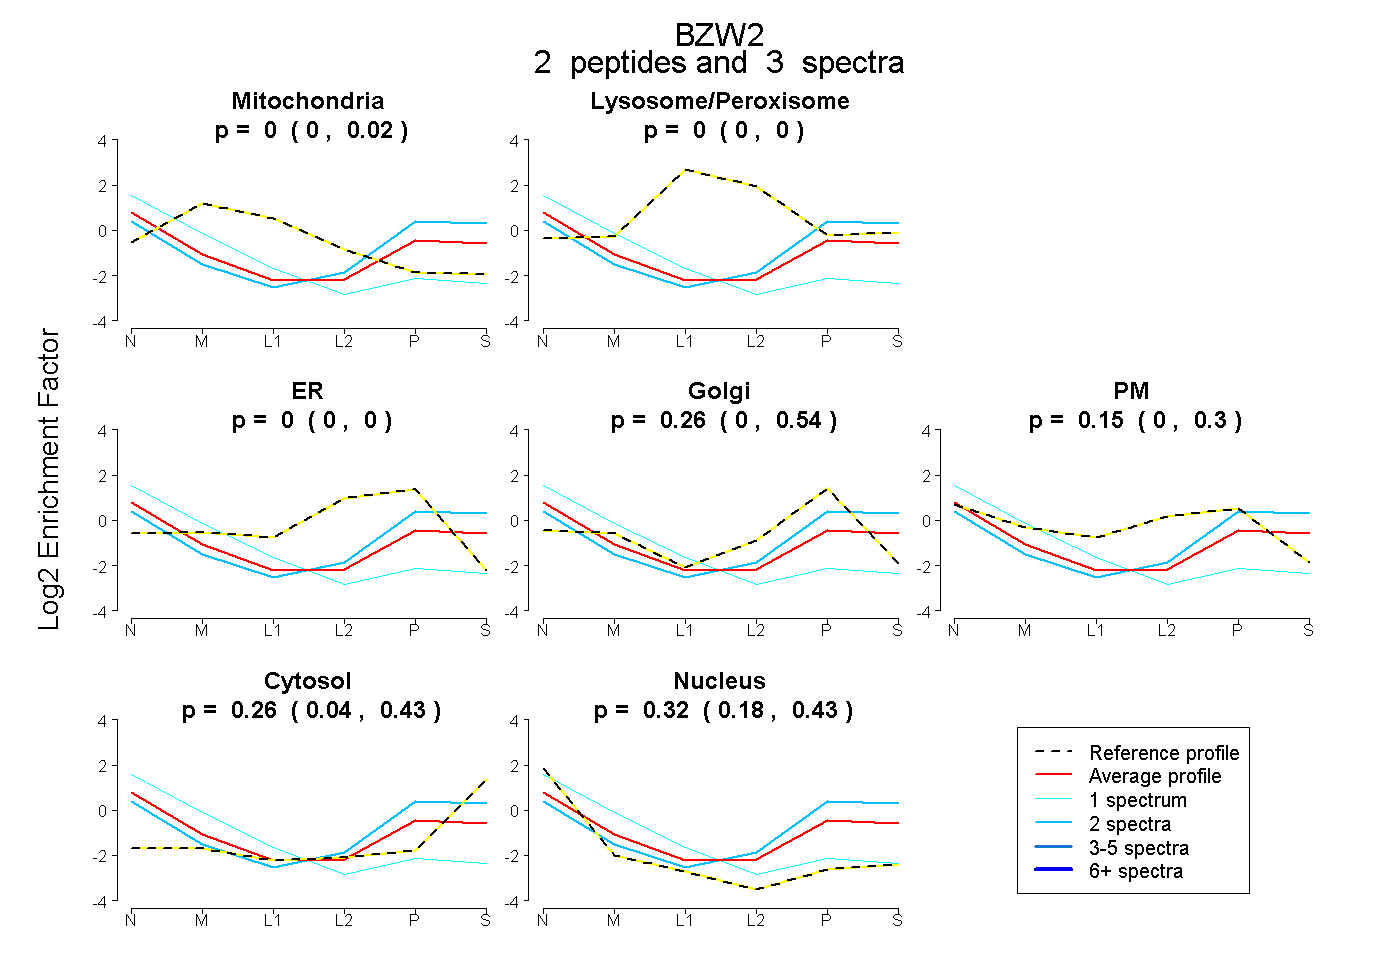
0.000 | 0.021
0.000 | 0.000
0.000 | 0.000
0.000 | 0.537
0.000 | 0.304
0.044 | 0.428
0.182 | 0.434
3peptides
spectra
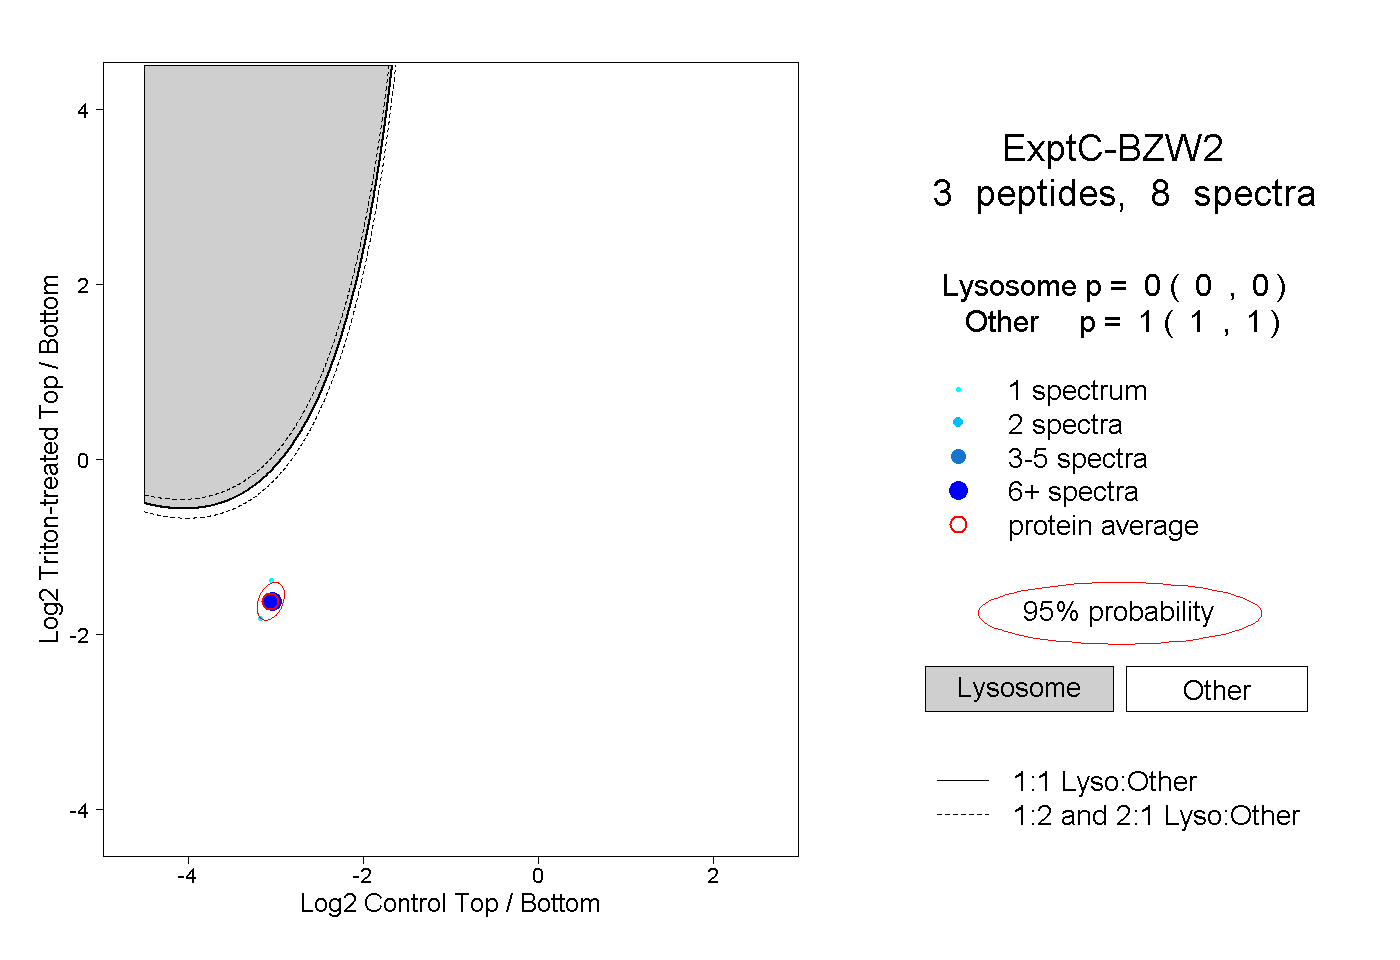
0.000 | 0.000
1.000 | 1.000