 2
2peptides
spectra
0.000 | 0.058
0.000 | 0.000
0.000 | 0.038
0.746 | 0.861
0.000 | 0.000
0.000 | 0.088
0.004 | 0.066
0.050 | 0.105
3peptides
spectra
0.000 | 0.000
1.000 | 1.000
| Plot | Mito | Lyso | Perox | ER | Golgi | PM | Cytosol | Nucleus | |||||
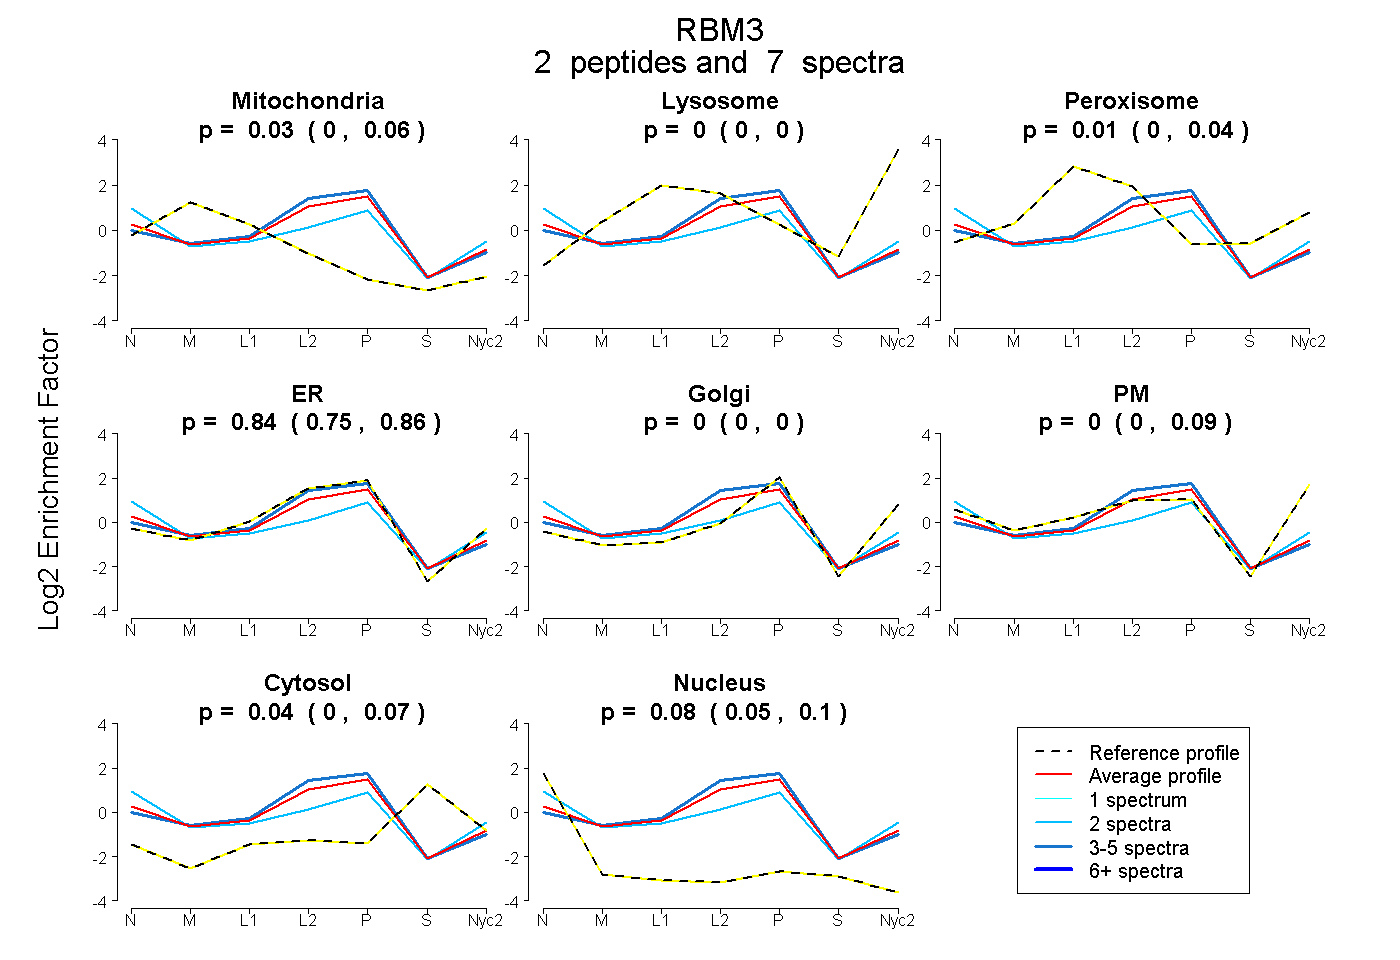
| Expt A |
2 peptides |
7 spectra |
|
0.034 0.000 | 0.058 |
0.000 0.000 | 0.000 |
0.006 0.000 | 0.038 |
0.843 0.746 | 0.861 |
0.000 0.000 | 0.000 |
0.000 0.000 | 0.088 |
0.040 0.004 | 0.066 |
0.077 0.050 | 0.105 |
||
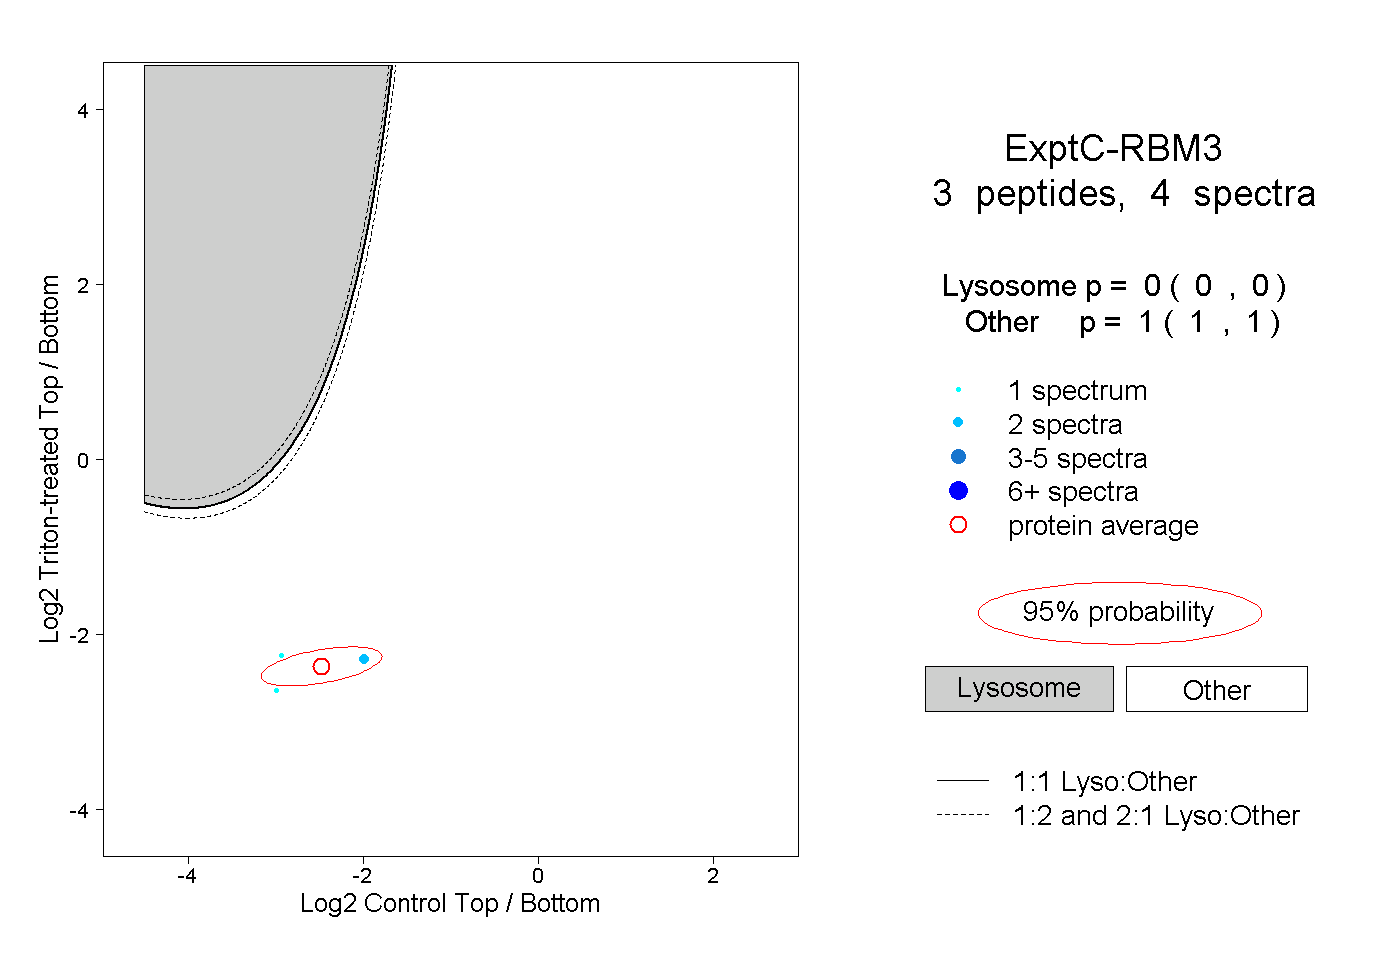
| Plot | Lyso | Other | |||||||||||
| Expt C |
3 peptides |
4 spectra |
|
0.000 0.000 | 0.000 |
1.000 1.000 | 1.000 |