 20
20peptides
spectra
0.000 | 0.000
0.000 | 0.000
0.000 | 0.000
0.000 | 0.000
0.000 | 0.000
0.000 | 0.000
0.949 | 0.956
0.044 | 0.051
| Plot | Mito | Lyso | Perox | ER | Golgi | PM | Cytosol | Nucleus | |||||
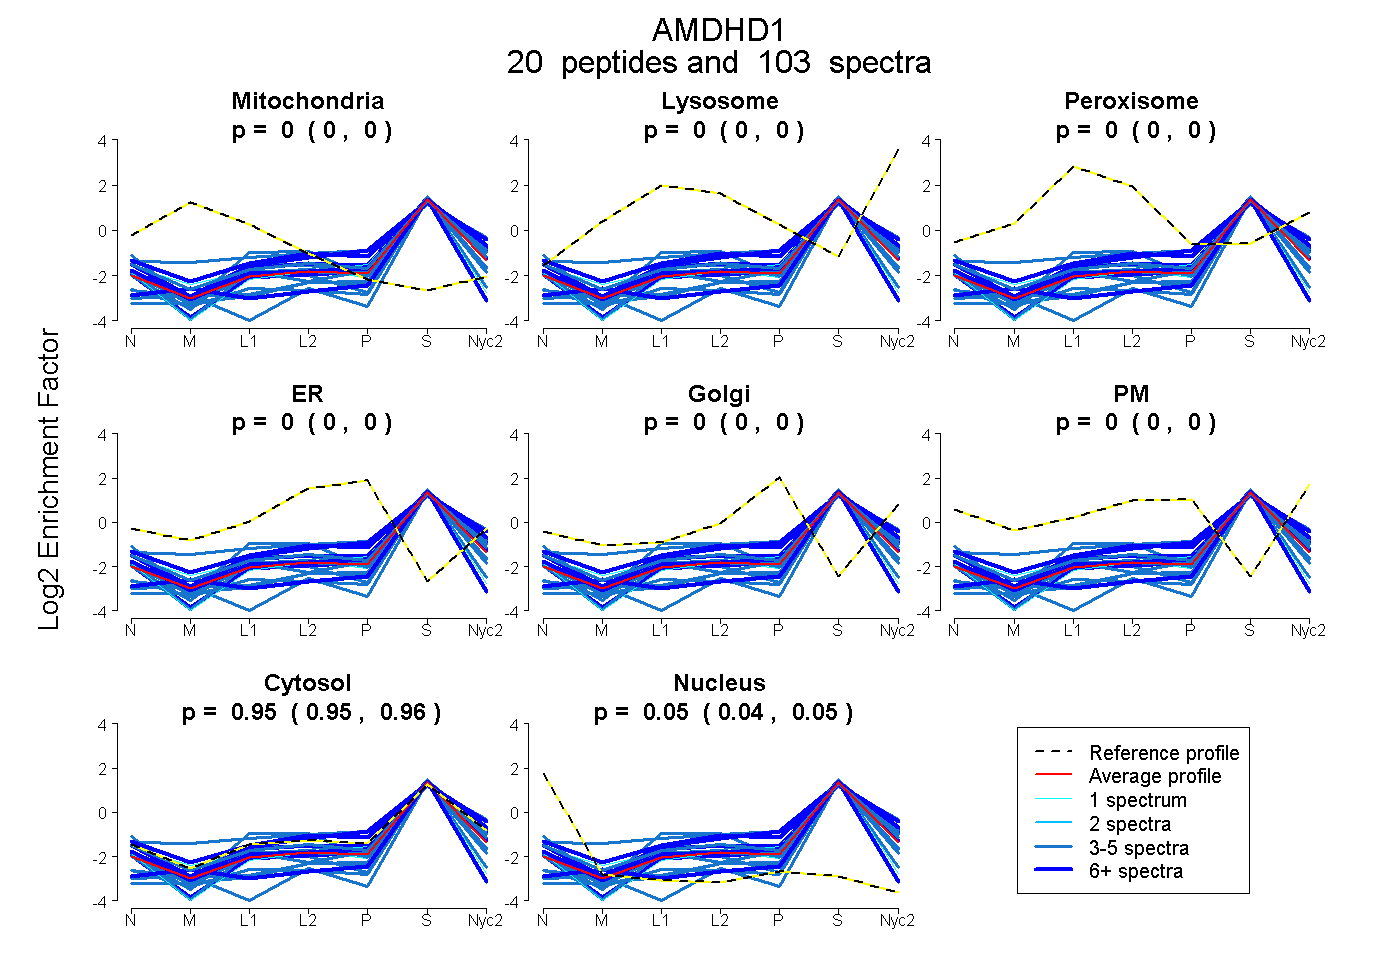
| Expt A |
20 peptides |
103 spectra |
|
0.000 0.000 | 0.000 |
0.000 0.000 | 0.000 |
0.000 0.000 | 0.000 |
0.000 0.000 | 0.000 |
0.000 0.000 | 0.000 |
0.000 0.000 | 0.000 |
0.953 0.949 | 0.956 |
0.047 0.044 | 0.051 |
| 3 spectra, LLLENAQQVVLVCAR | 0.000 | 0.000 | 0.000 | 0.000 | 0.000 | 0.000 | 0.809 | 0.191 | ||
| 1 spectrum, AAELGAELGAR | 0.000 | 0.000 | 0.000 | 0.000 | 0.000 | 0.000 | 0.962 | 0.038 | ||
| 10 spectra, VGLQINFHGDELHPMK | 0.000 | 0.000 | 0.000 | 0.000 | 0.000 | 0.000 | 0.991 | 0.009 | ||
| 3 spectra, LLEGGK | 0.037 | 0.121 | 0.000 | 0.000 | 0.021 | 0.000 | 0.821 | 0.000 | ||
| 1 spectrum, SHTHGSLEVGK | 0.000 | 0.000 | 0.000 | 0.000 | 0.000 | 0.000 | 0.860 | 0.140 | ||
| 4 spectra, QGDAIIINASR | 0.000 | 0.000 | 0.000 | 0.000 | 0.000 | 0.000 | 0.979 | 0.021 | ||
| 3 spectra, GVFDLDTTR | 0.000 | 0.000 | 0.000 | 0.000 | 0.000 | 0.000 | 0.985 | 0.015 | ||
| 6 spectra, QFSGETFEER | 0.000 | 0.054 | 0.000 | 0.000 | 0.019 | 0.000 | 0.927 | 0.000 | ||
| 8 spectra, LQCMMR | 0.000 | 0.000 | 0.000 | 0.000 | 0.020 | 0.000 | 0.980 | 0.000 | ||
| 4 spectra, GELHVDNIDVFCEK | 0.000 | 0.000 | 0.000 | 0.000 | 0.000 | 0.000 | 0.899 | 0.101 | ||
| 3 spectra, SGYGLNLETELK | 0.000 | 0.000 | 0.000 | 0.000 | 0.000 | 0.000 | 0.968 | 0.032 | ||
| 4 spectra, AGTTLVECK | 0.000 | 0.000 | 0.000 | 0.000 | 0.000 | 0.000 | 0.903 | 0.097 | ||
| 5 spectra, GELYLTGSELR | 0.000 | 0.000 | 0.000 | 0.000 | 0.000 | 0.000 | 1.000 | 0.000 | ||
| 11 spectra, QASEEELFR | 0.000 | 0.000 | 0.000 | 0.000 | 0.000 | 0.000 | 0.990 | 0.010 | ||
| 7 spectra, AVGPADIIR | 0.000 | 0.000 | 0.000 | 0.000 | 0.000 | 0.000 | 0.955 | 0.045 | ||
| 5 spectra, LAGATYMDIHQAGGGINFTVEHTR | 0.000 | 0.000 | 0.000 | 0.000 | 0.000 | 0.000 | 0.779 | 0.221 | ||
| 5 spectra, MSMPEALAAATINAAYALGK | 0.000 | 0.000 | 0.000 | 0.000 | 0.000 | 0.000 | 0.923 | 0.077 | ||
| 4 spectra, VHEFAMK | 0.000 | 0.000 | 0.000 | 0.000 | 0.000 | 0.000 | 0.973 | 0.027 | ||
| 4 spectra, CILPGLVDAHTHPVWAGER | 0.000 | 0.000 | 0.000 | 0.000 | 0.000 | 0.000 | 1.000 | 0.000 | ||
| 12 spectra, TAVEAADDIISHHLPR | 0.000 | 0.000 | 0.000 | 0.000 | 0.000 | 0.000 | 0.820 | 0.180 |
| Plot | Mito | Lyso or Perox | ER | Golgi | PM | Cytosol | Nucleus | ||||||
| Expt B |
15 peptides |
57 spectra |
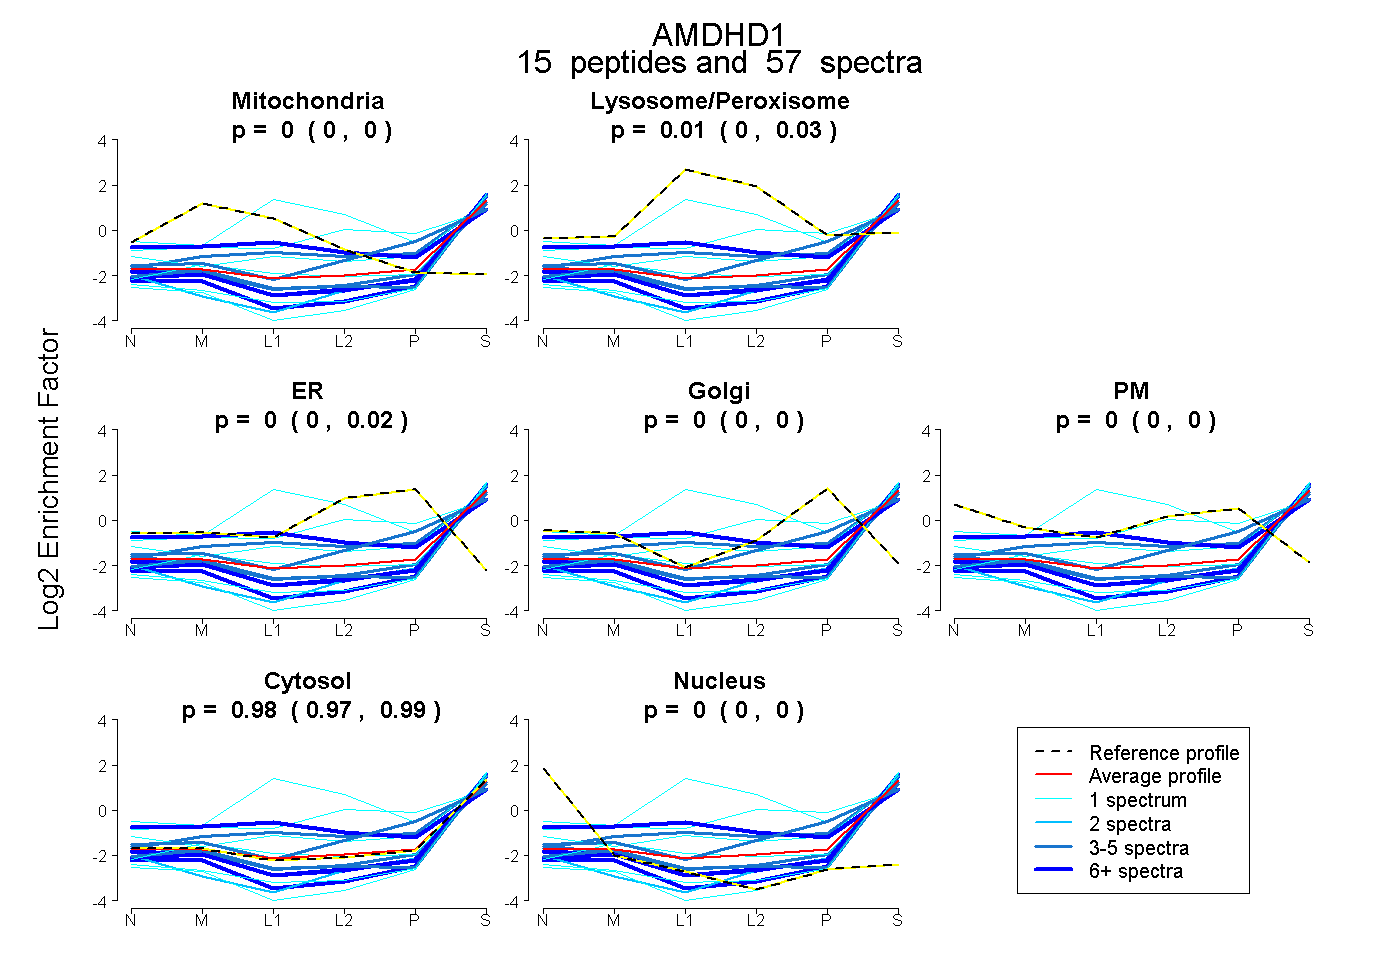 |
0.000 0.000 | 0.000 |
0.015 0.000 | 0.026 |
0.004 0.000 | 0.015 |
0.000 0.000 | 0.000 |
0.000 0.000 | 0.000 |
0.981 0.970 | 0.988 |
0.000 0.000 | 0.004 |
|||
| Plot | Lyso | Other | |||||||||||
| Expt C |
16 peptides |
96 spectra |
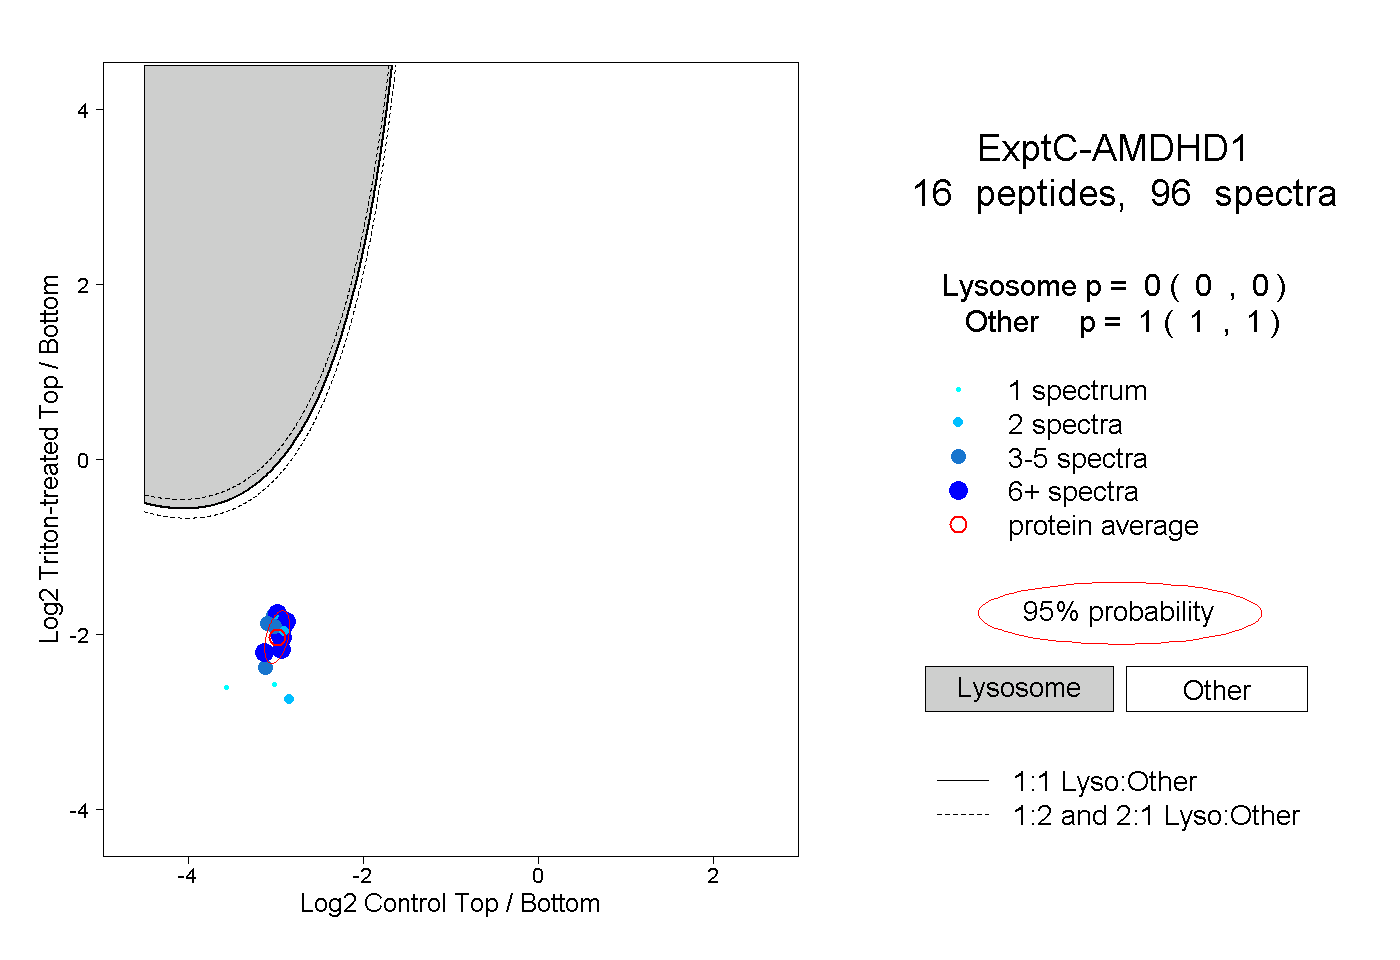 |
0.000 0.000 | 0.000 |
1.000 1.000 | 1.000 |
||||||||
| Plot | Lyso | Other | |||||||||||
| Expt D |
7 peptides |
12 spectra |
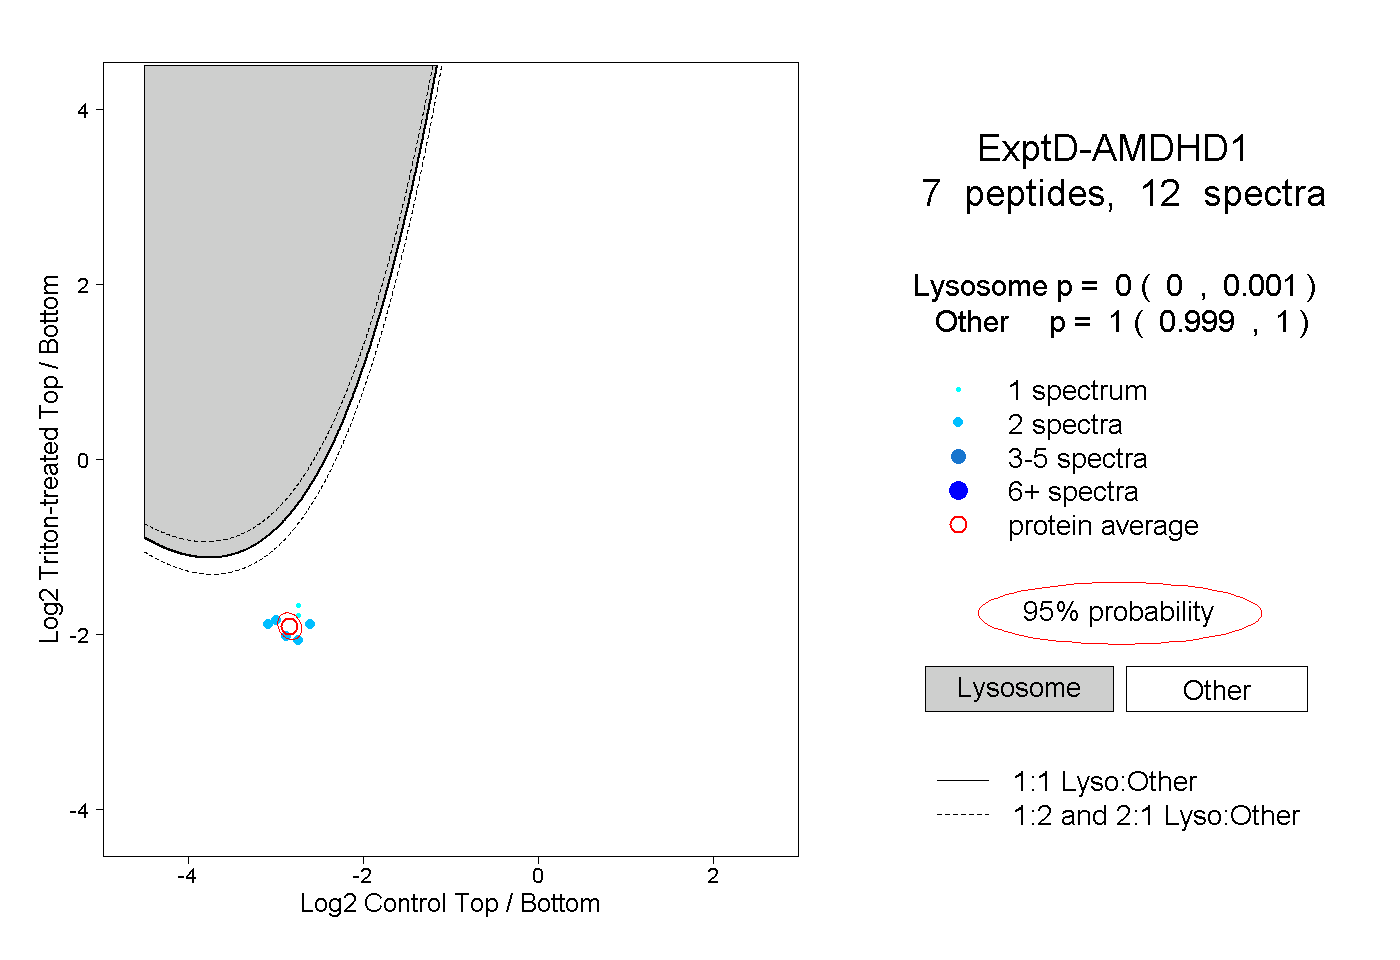 |
0.000 0.000 | 0.001 |
1.000 0.999 | 1.000 |