 20
20peptides
spectra
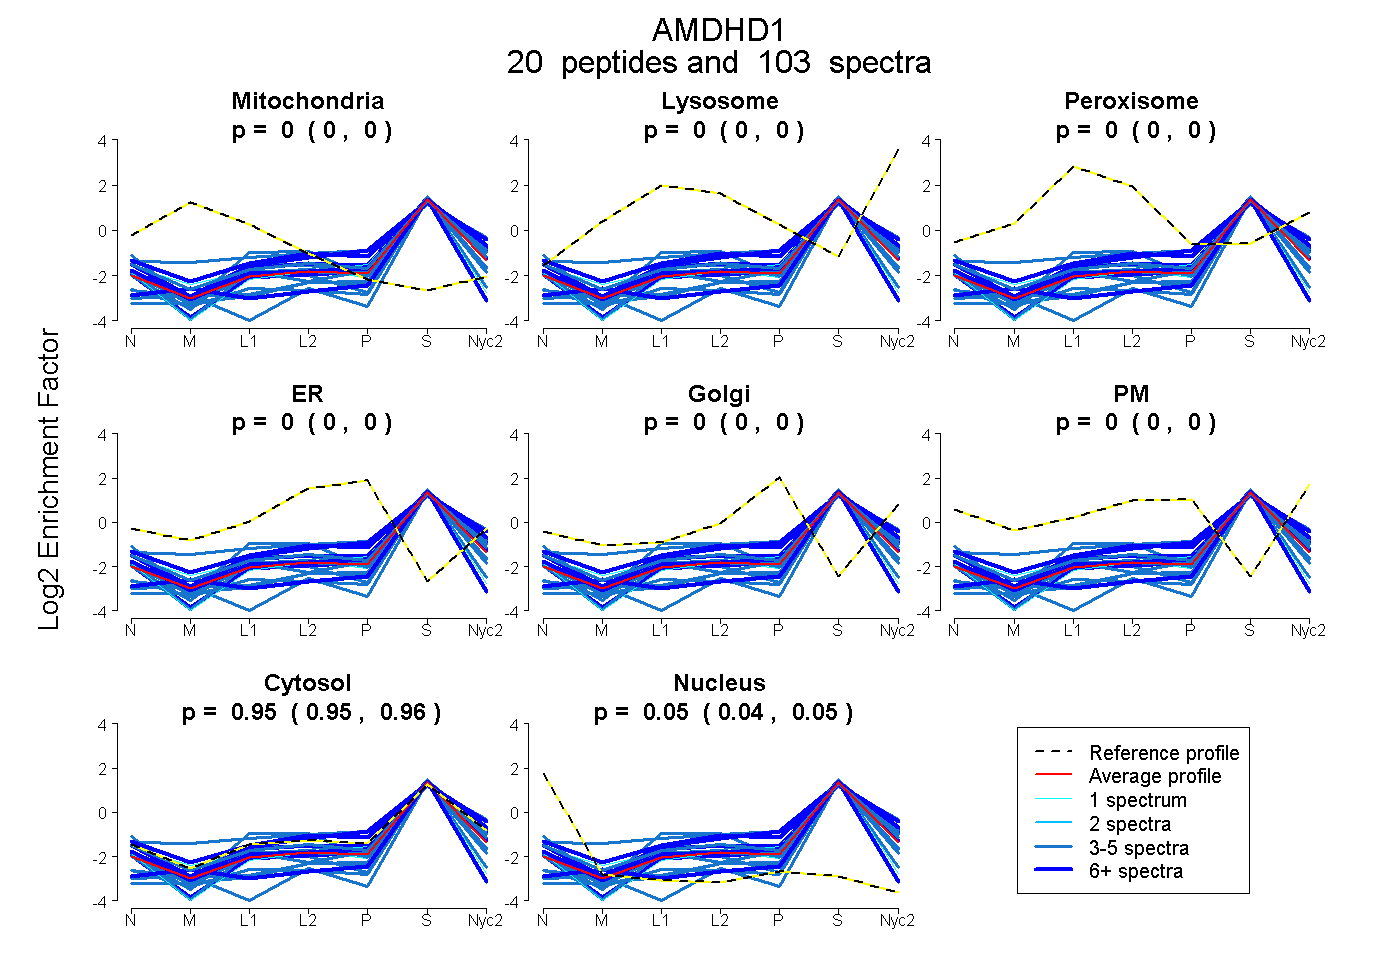
0.000 | 0.000
0.000 | 0.000
0.000 | 0.000
0.000 | 0.000
0.000 | 0.000
0.000 | 0.000
0.949 | 0.956
0.044 | 0.051
15peptides
spectra
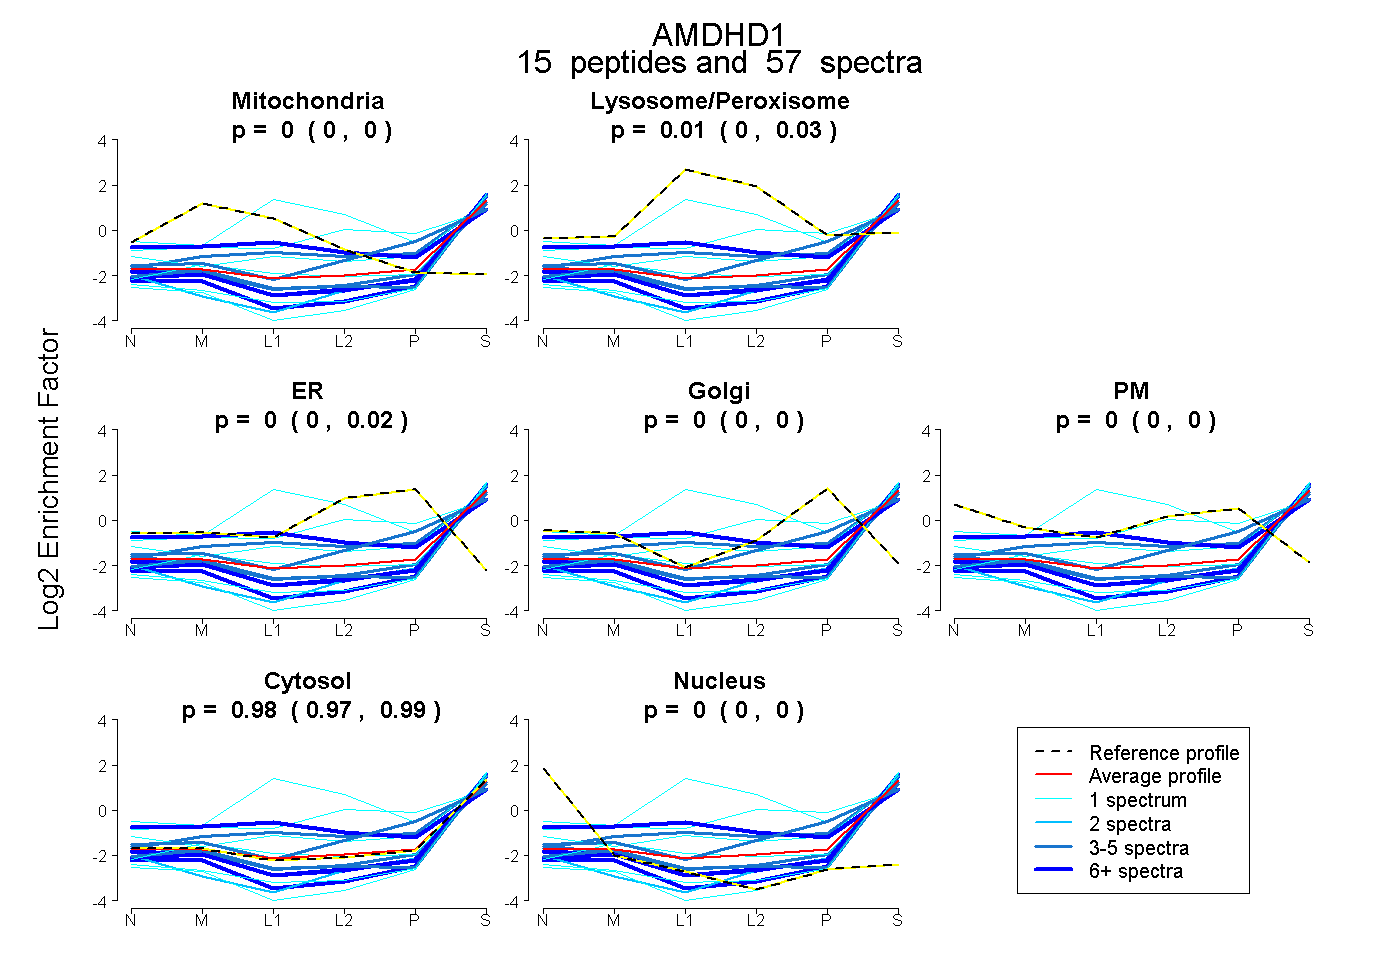
0.000 | 0.000
0.000 | 0.026
0.000 | 0.015
0.000 | 0.000
0.000 | 0.000
0.970 | 0.988
0.000 | 0.004
16peptides
spectra
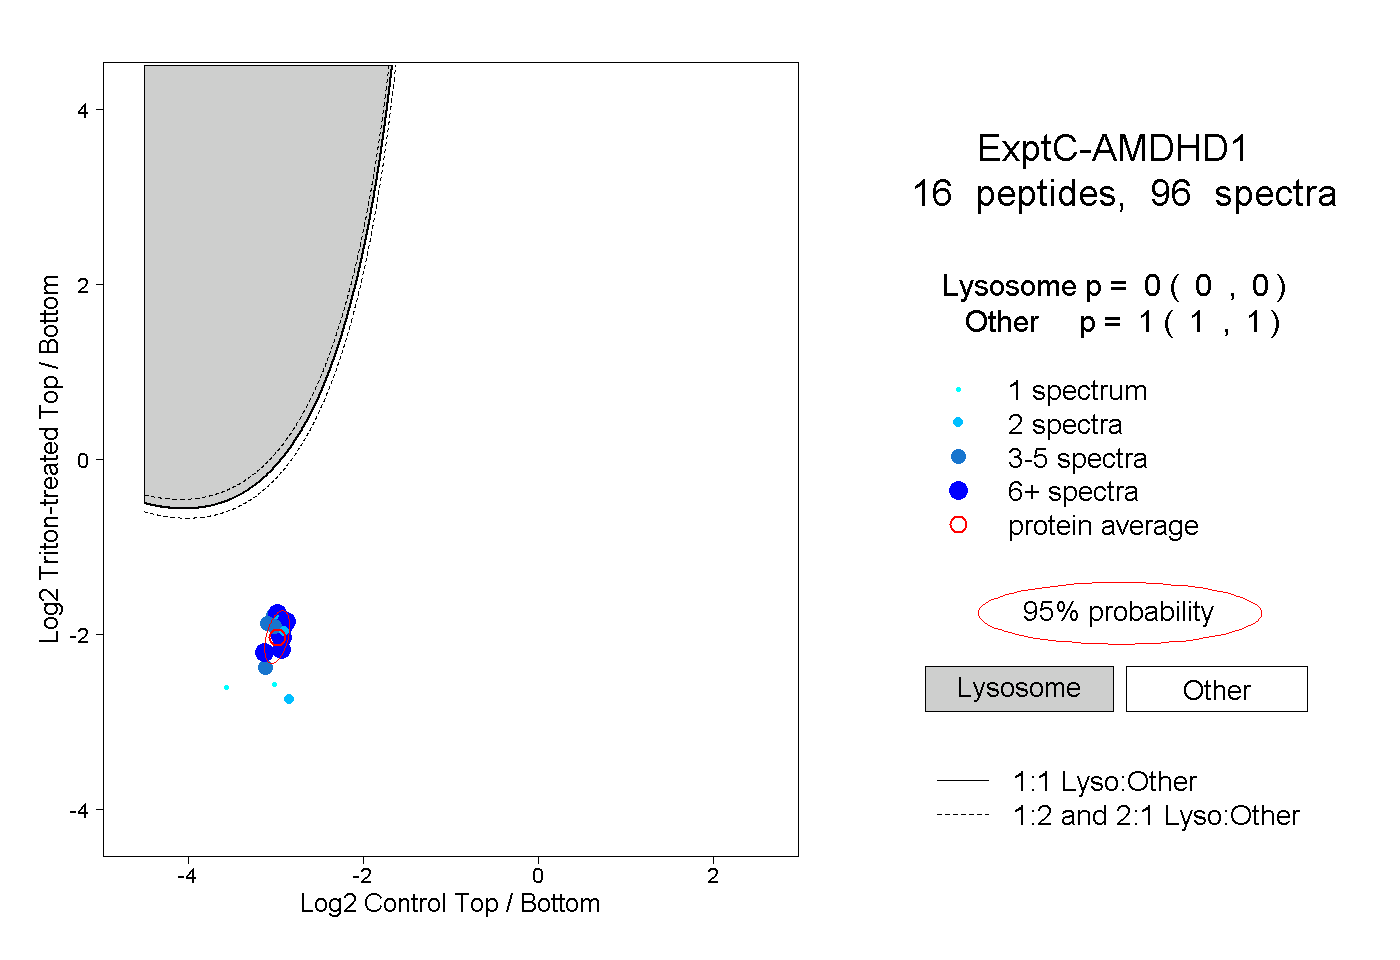
0.000 | 0.000
1.000 | 1.000
7peptides
spectra
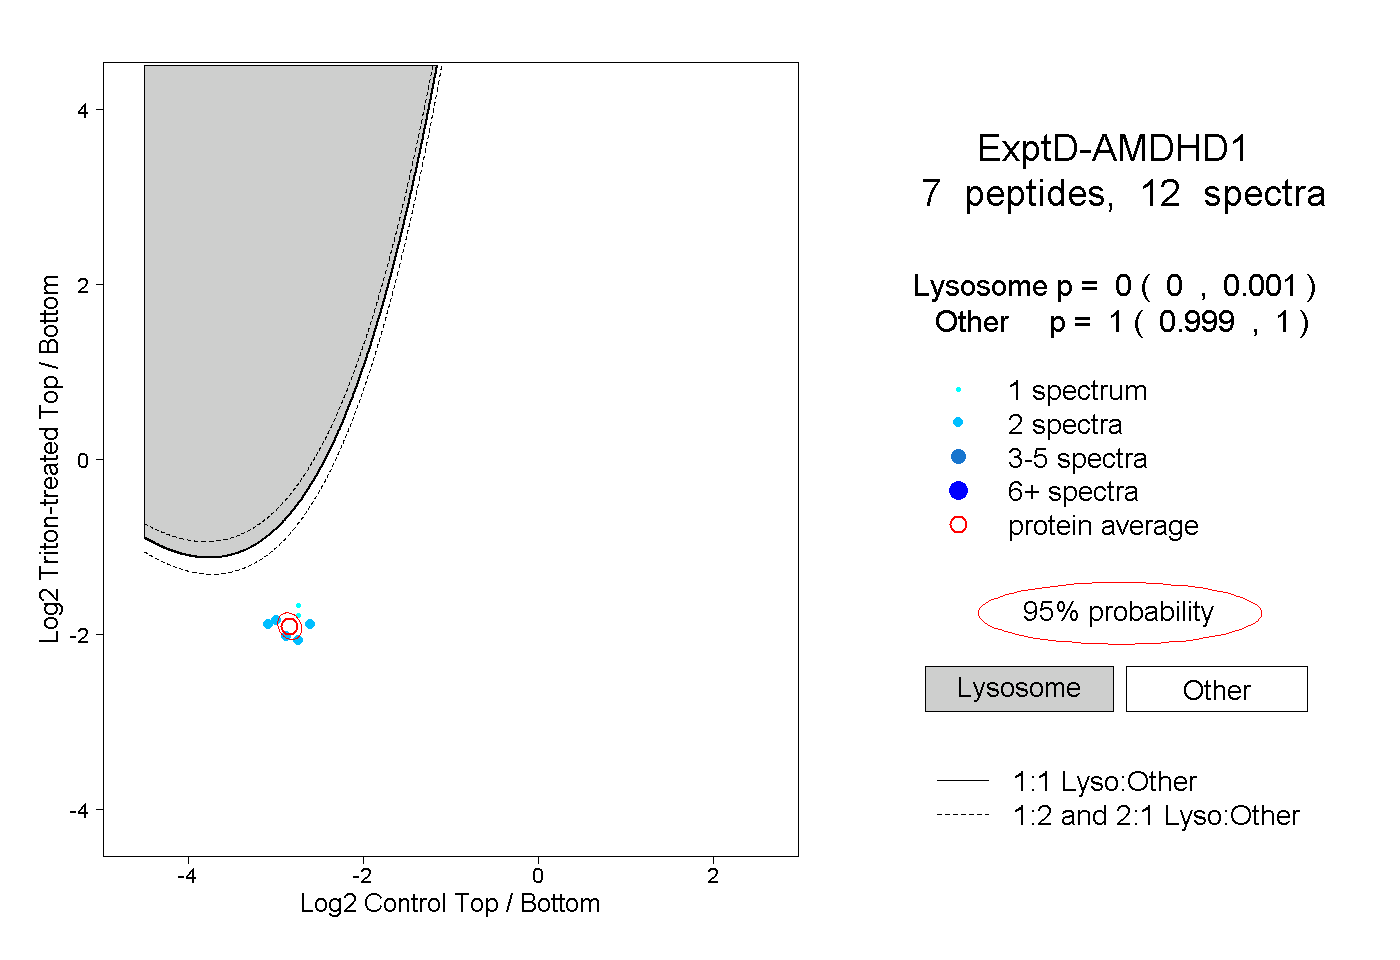
0.000 | 0.001
0.999 | 1.000