 15
15peptides
spectra
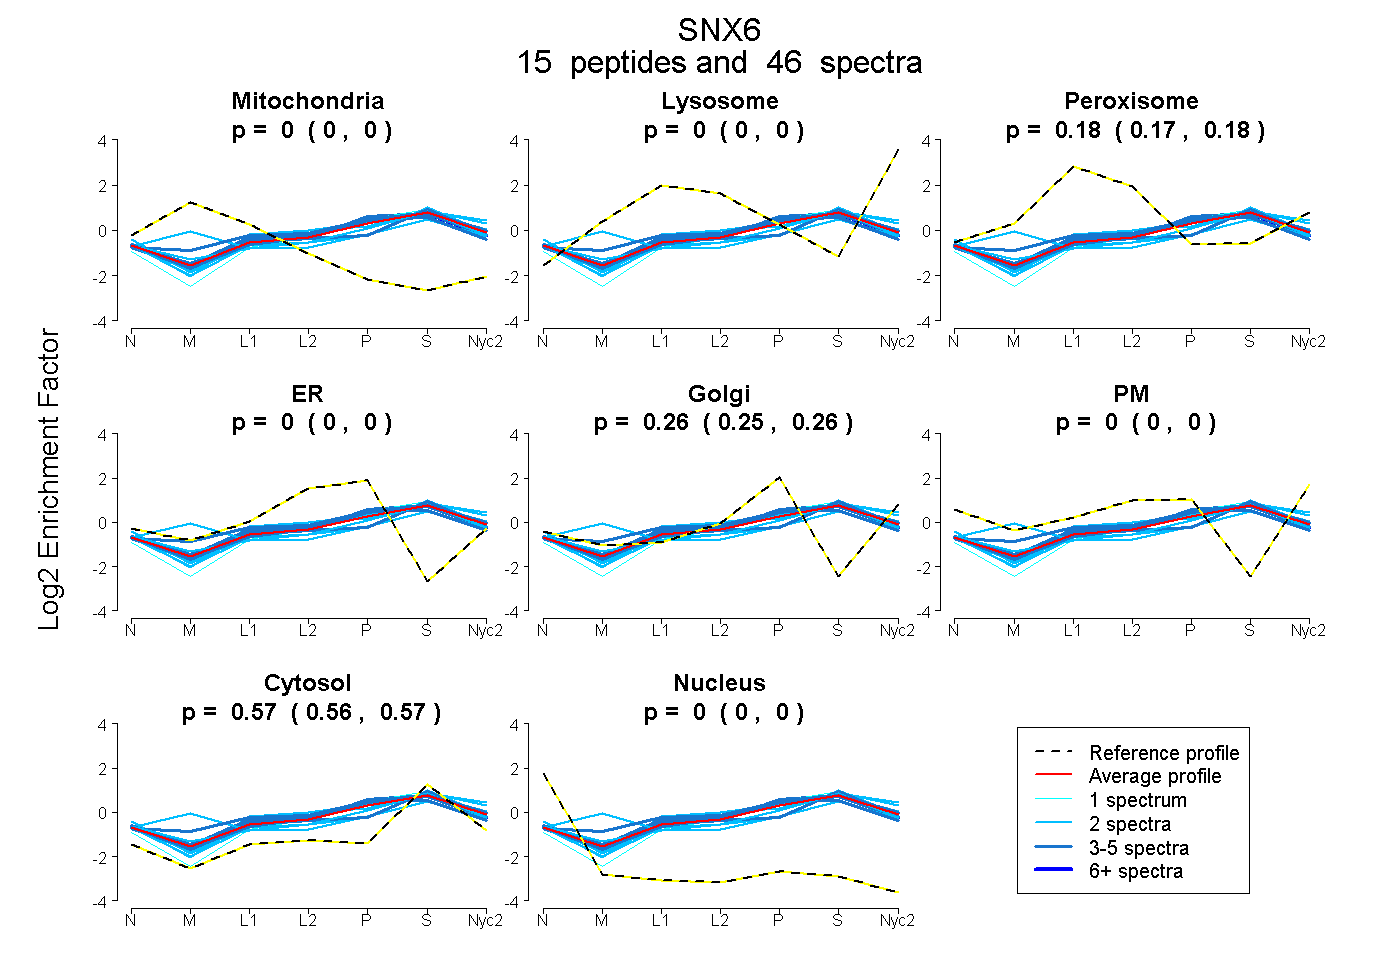
0.000 | 0.000
0.000 | 0.000
0.174 | 0.181
0.000 | 0.000
0.252 | 0.259
0.000 | 0.000
0.563 | 0.569
0.000 | 0.000
4peptides
spectra
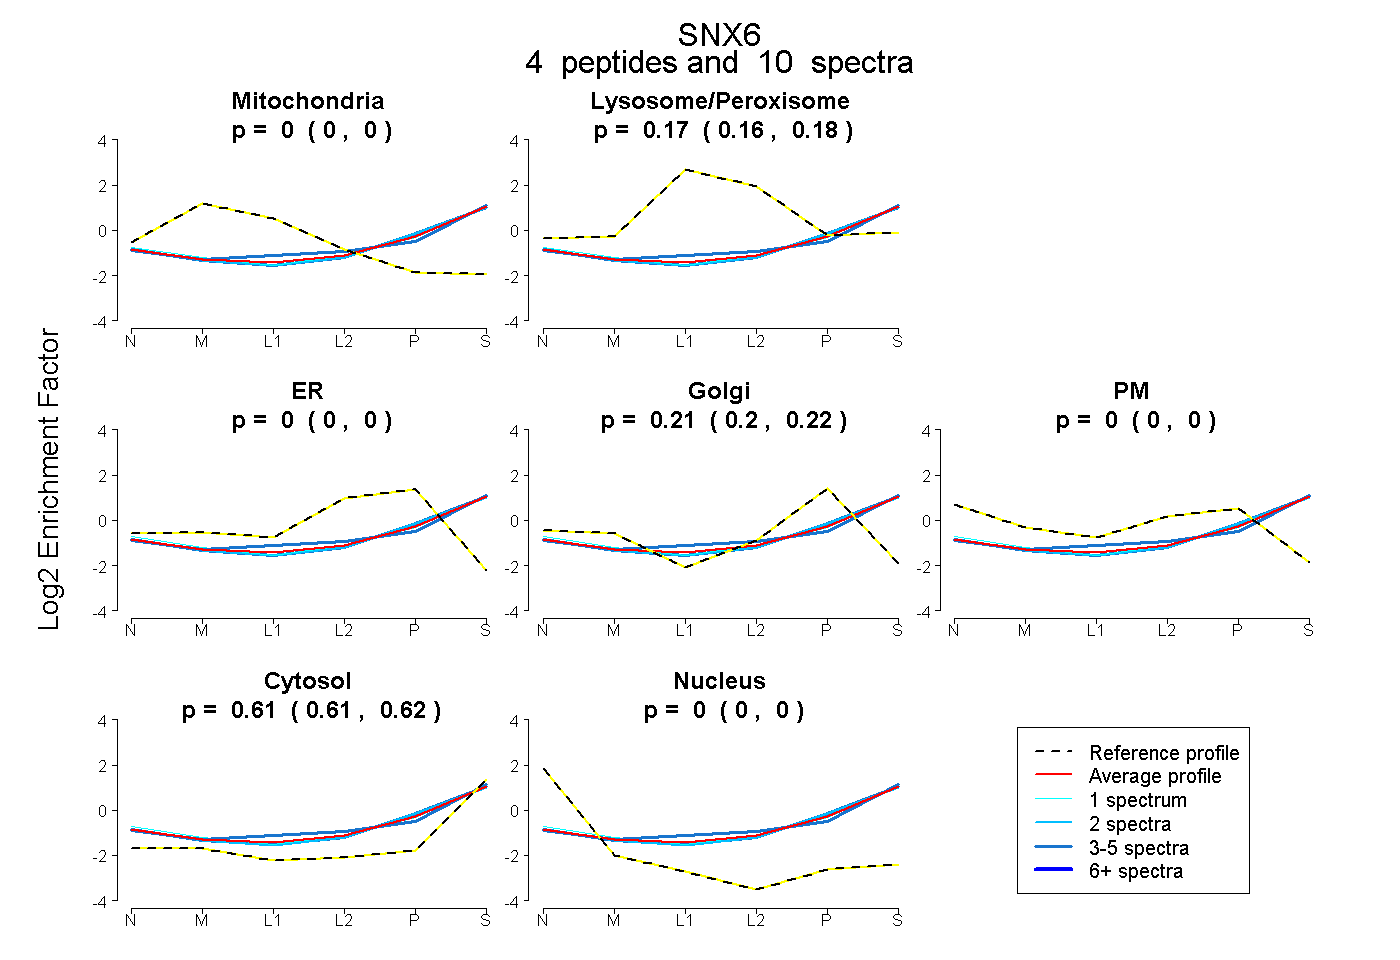
0.000 | 0.000
0.161 | 0.181
0.000 | 0.000
0.203 | 0.223
0.000 | 0.000
0.605 | 0.621
0.000 | 0.000
17peptides
spectra
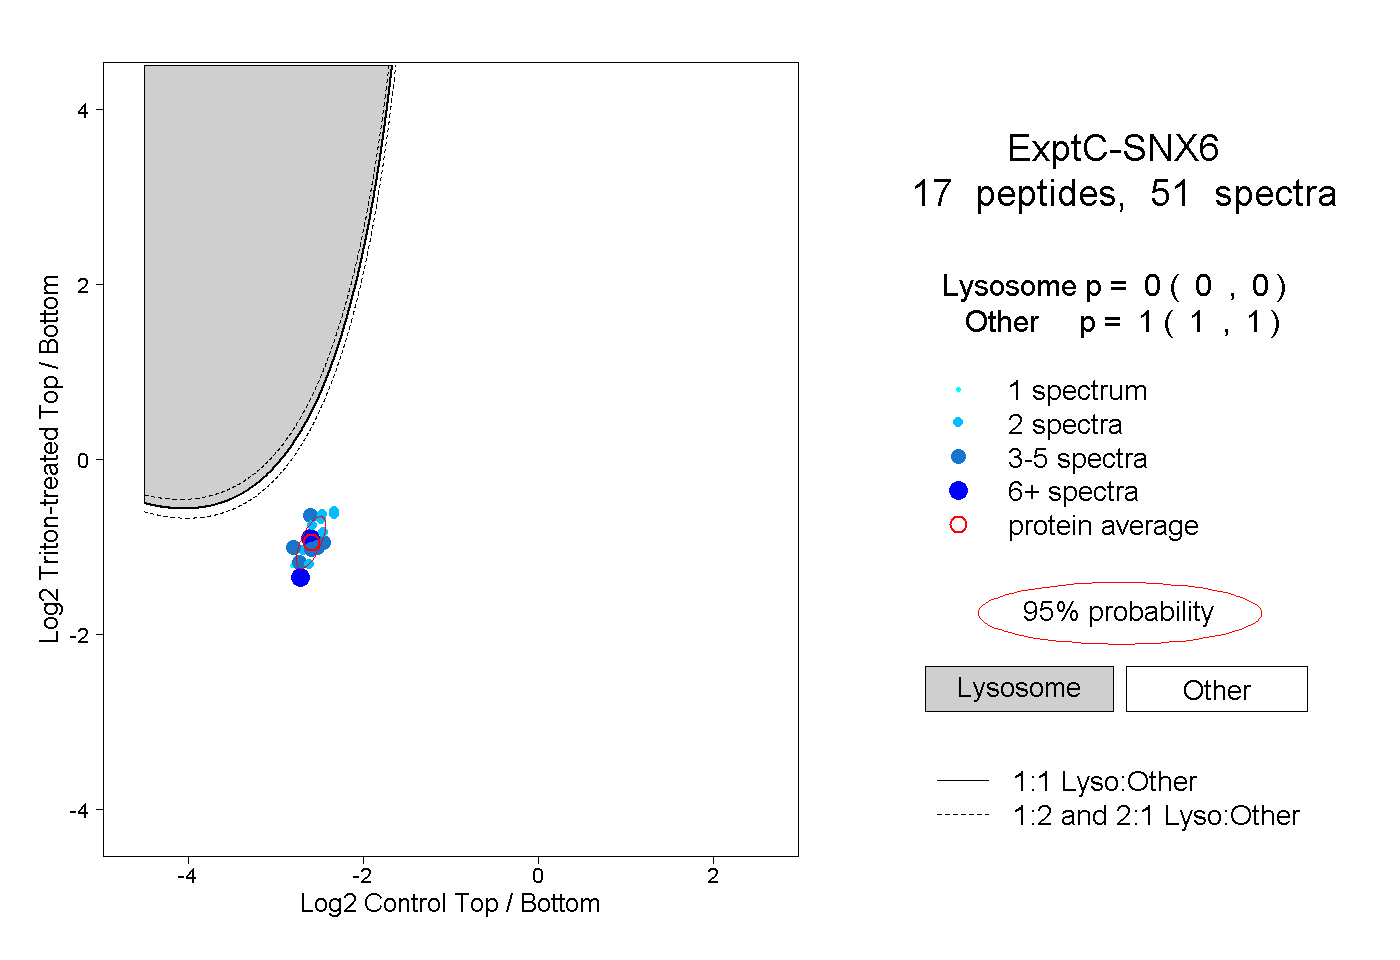
0.000 | 0.000
1.000 | 1.000
6peptides
spectra
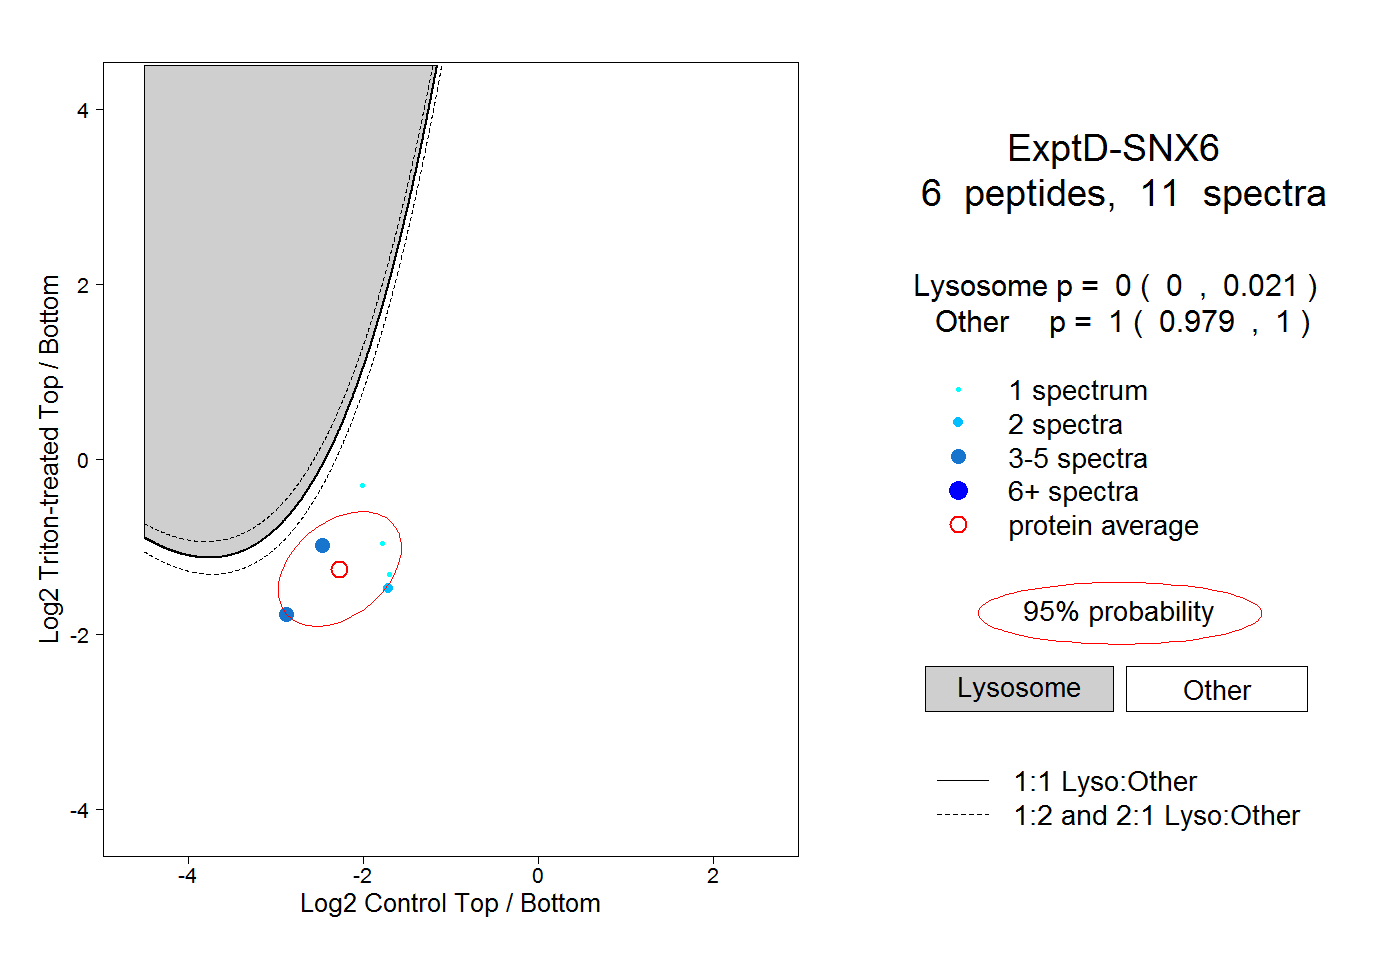
0.000 | 0.021
0.979 | 1.000