SNX6
[ENSRNOP00000007300]
Main page
| | | Plot |
Mito |
Lyso |
|
Perox |
ER |
Golgi |
PM |
Cytosol |
Nucleus |
|
| Expt A |
 15
15
peptides |
46
spectra |
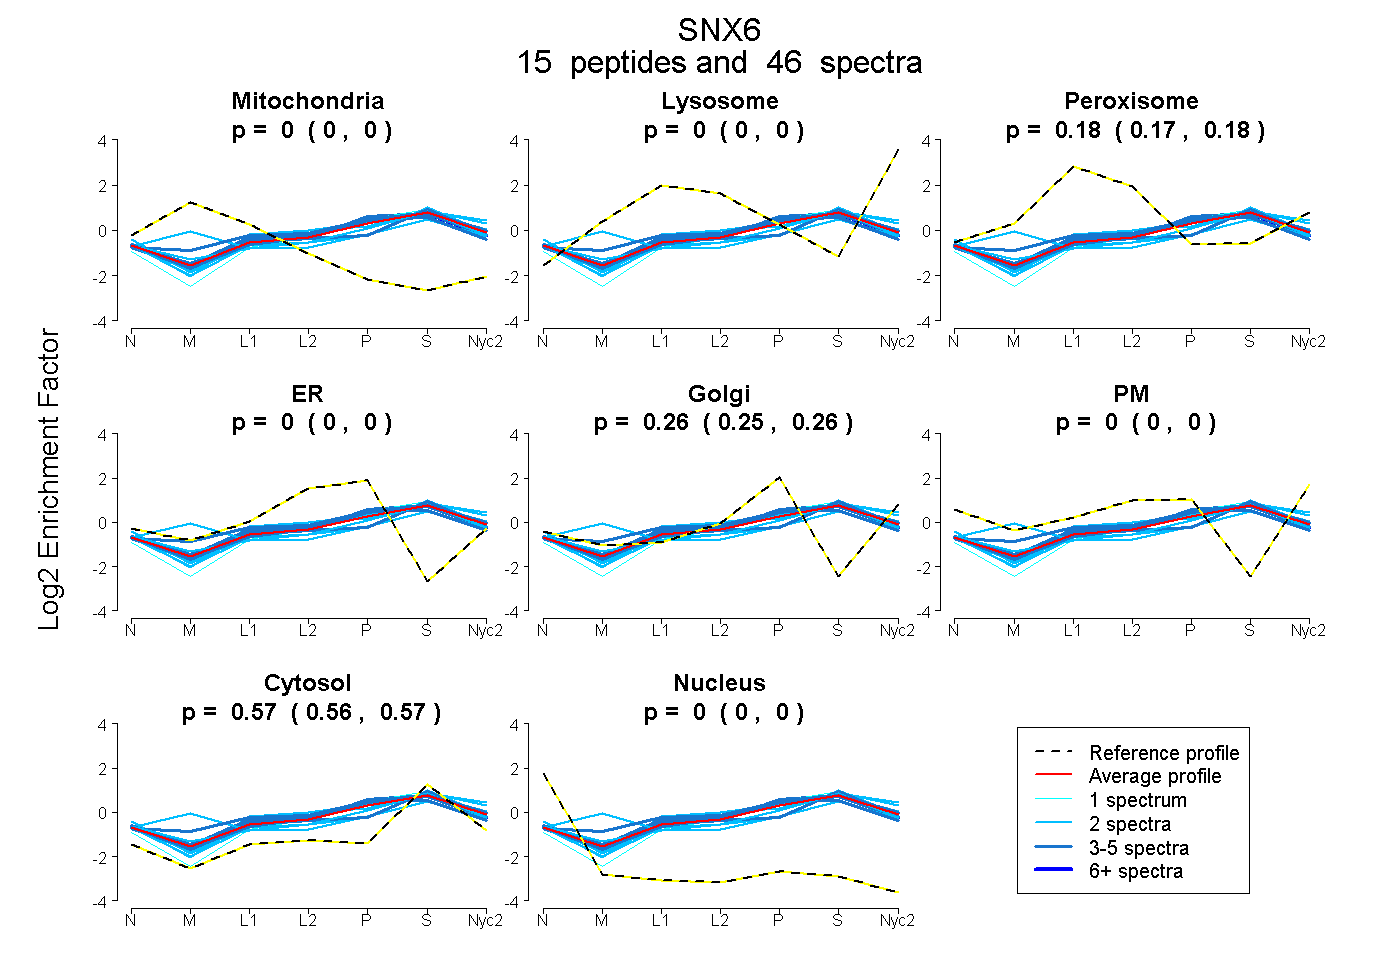 |
0.000
0.000 | 0.000 |
0.000
0.000 | 0.000 |
|
0.178
0.174 | 0.181 |
0.000
0.000 | 0.000 |
0.256
0.252 | 0.259 |
0.000
0.000 | 0.000 |
0.566
0.563 | 0.569 |
0.000
0.000 | 0.000 |
|
| | | Plot |
Mito |
|
Lyso or Perox |
|
ER |
Golgi |
PM |
Cytosol |
Nucleus |
|
| Expt B |
4
peptides |
10
spectra |
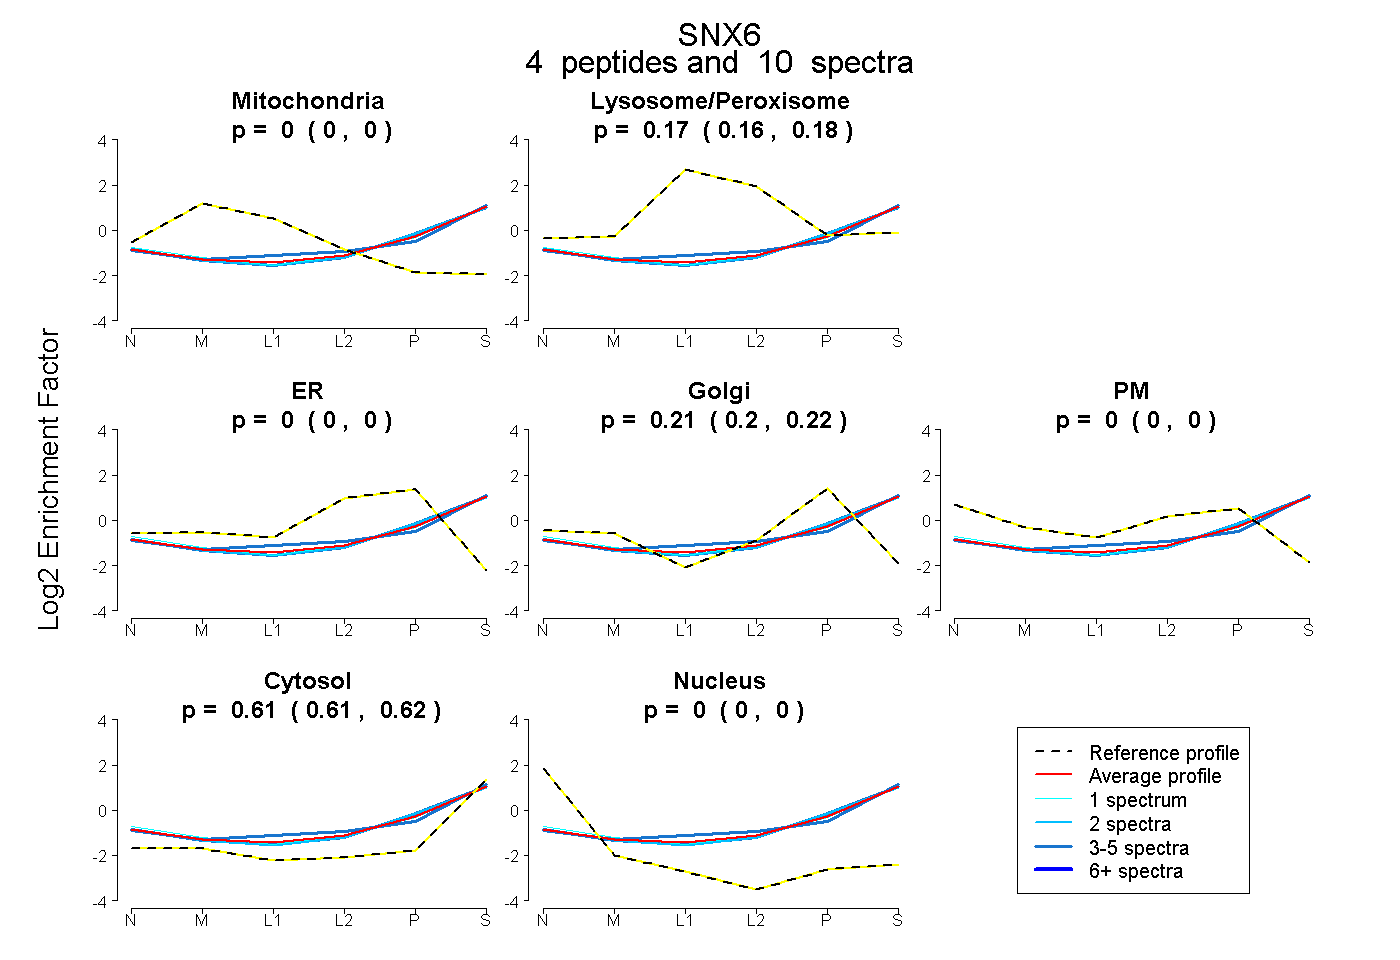 |
0.000
0.000 | 0.000 |
|
0.172
0.161 | 0.181 |
|
0.000
0.000 | 0.000 |
0.214
0.203 | 0.223 |
0.000
0.000 | 0.000 |
0.614
0.605 | 0.621 |
0.000
0.000 | 0.000 |
|
| 2 spectra, NLVELAELELK |
0.000 |
|
0.140 |
|
0.000 |
0.253 |
0.000 |
0.607 |
0.000 |
|
| 1 spectrum, QNEFSVVR |
0.000 |
|
0.154 |
|
0.000 |
0.222 |
0.012 |
0.613 |
0.000 |
|
| 3 spectra, VAAHPILR |
0.000 |
|
0.237 |
|
0.000 |
0.139 |
0.000 |
0.624 |
0.000 |
|
| 4 spectra, DVDDFFEHER |
0.000 |
|
0.145 |
|
0.000 |
0.247 |
0.000 |
0.608 |
0.000 |
|
| | | Plot |
|
Lyso |
|
|
|
|
|
|
|
Other |
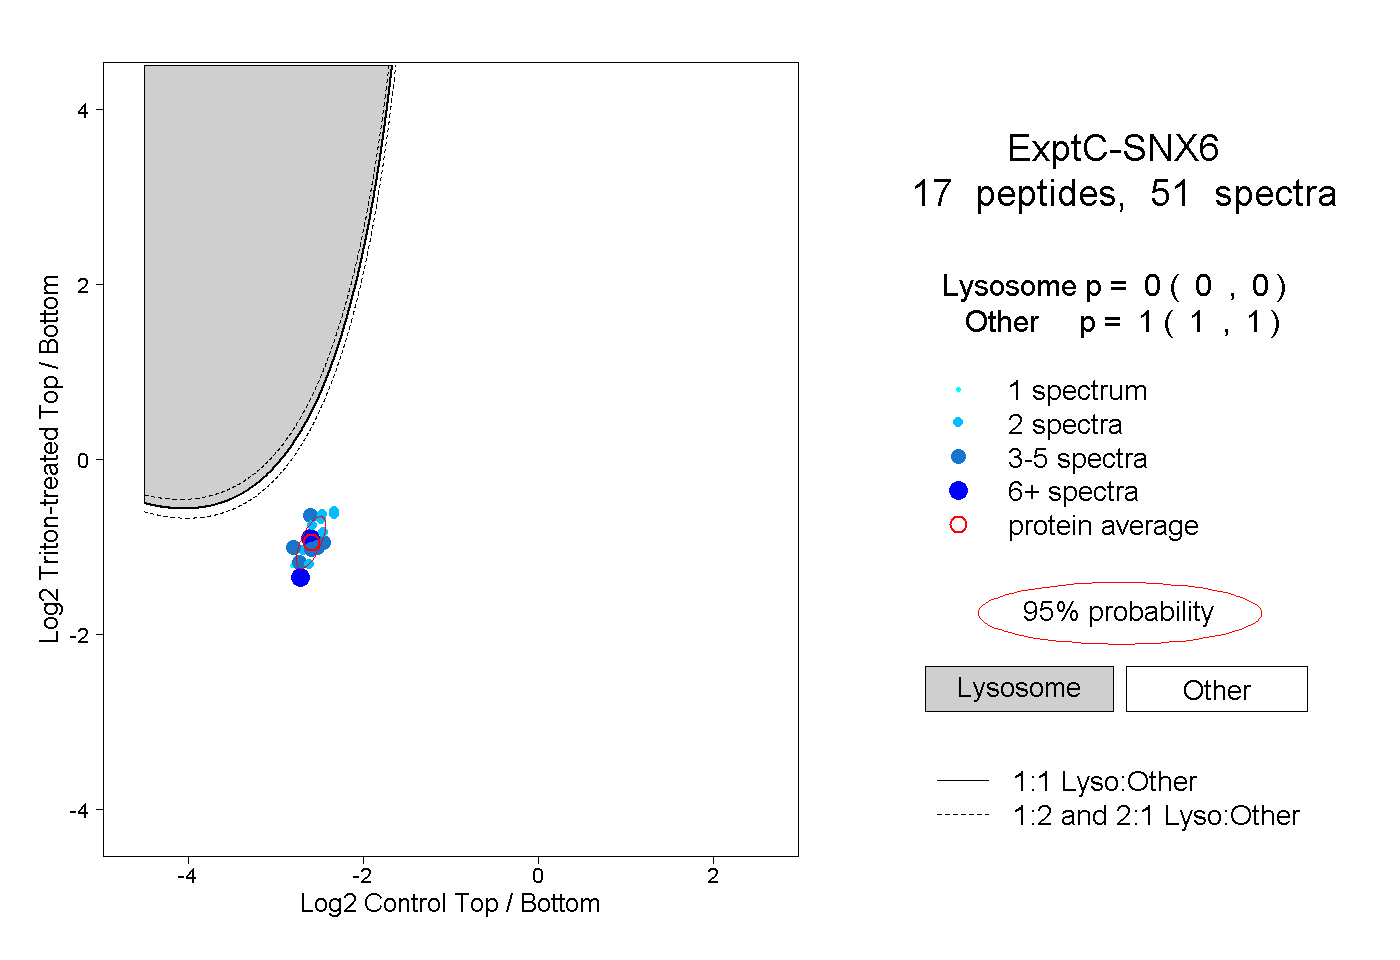
| Expt C |
17
peptides |
51
spectra |
 |
|
0.000
0.000 | 0.000 |
|
|
|
|
|
|
|
1.000
1.000 | 1.000 |
| | | Plot |
|
Lyso |
|
|
|
|
|
|
|
Other |
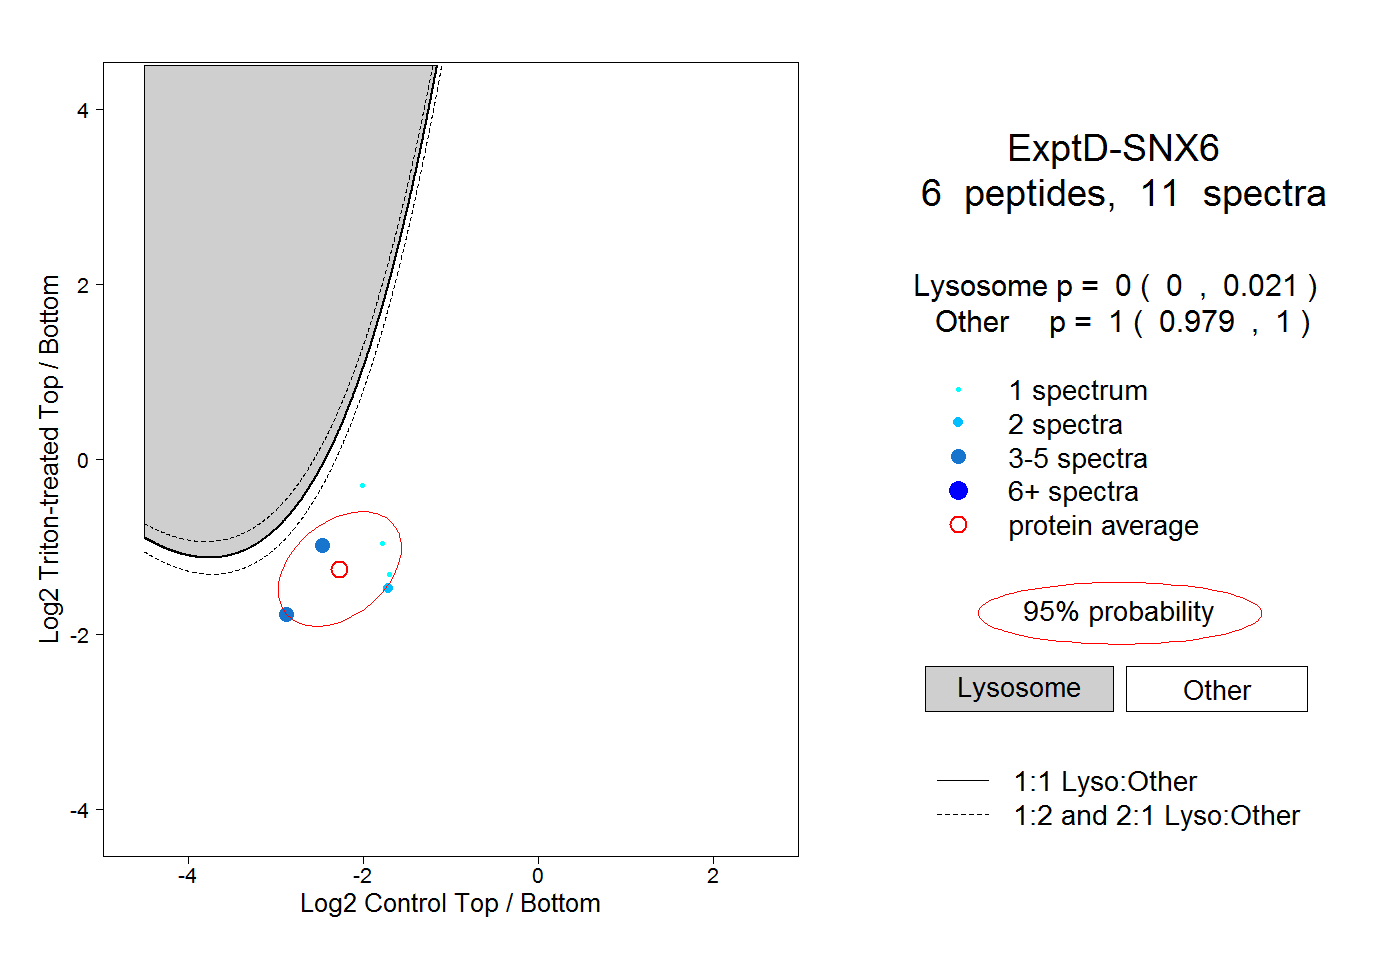
| Expt D |
6
peptides |
11
spectra |
 |
|
0.000
0.000 | 0.021 |
|
|
|
|
|
|
|
1.000
0.979 | 1.000 |