 15
15peptides
spectra
0.000 | 0.000
0.000 | 0.000
0.174 | 0.181
0.000 | 0.000
0.252 | 0.259
0.000 | 0.000
0.563 | 0.569
0.000 | 0.000
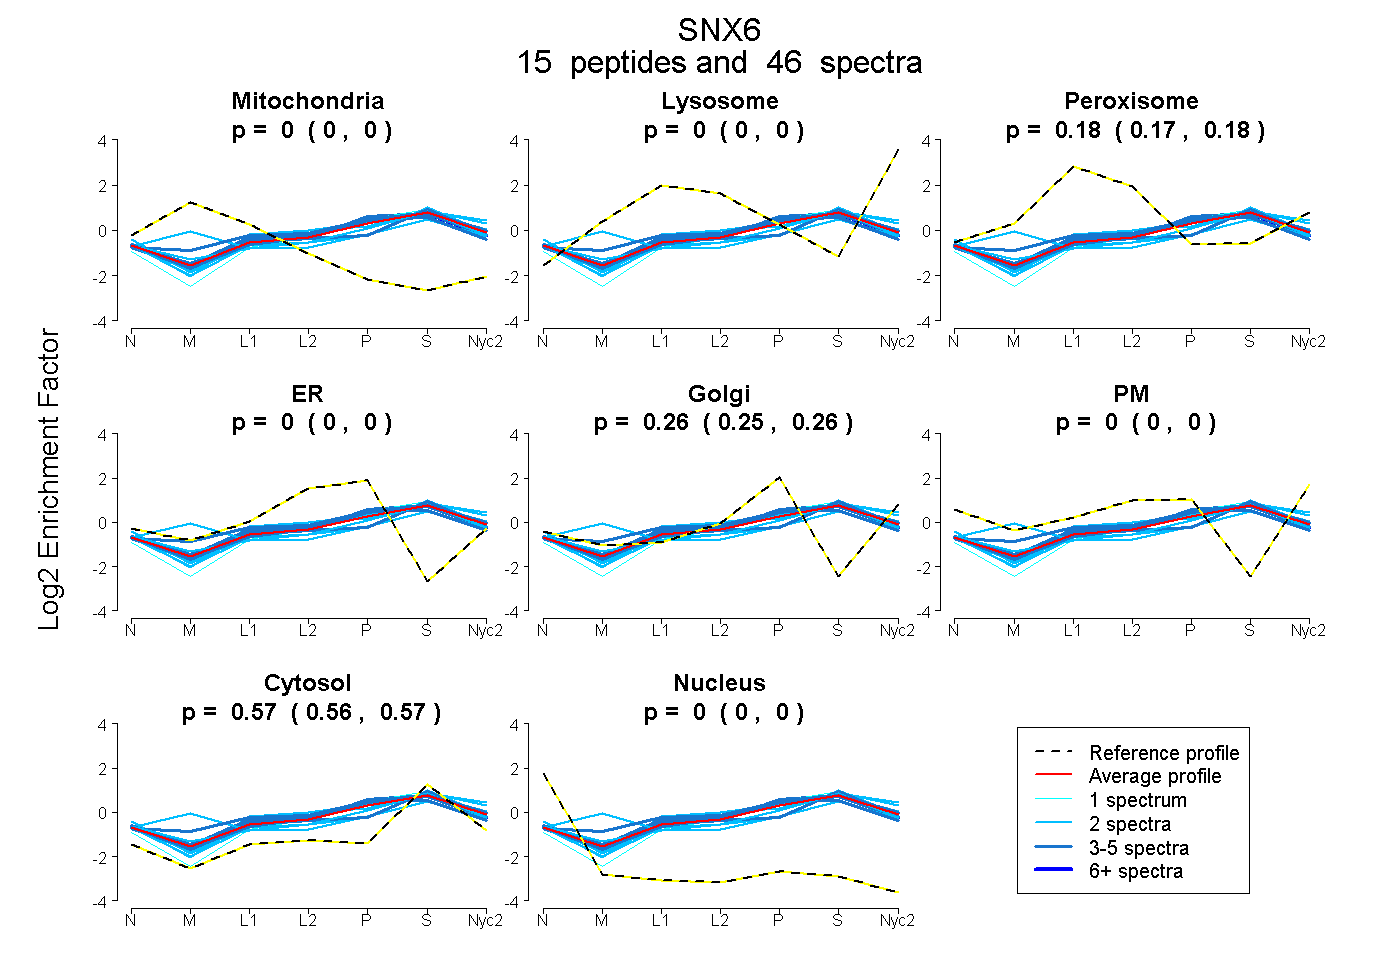
| Plot | Mito | Lyso | Perox | ER | Golgi | PM | Cytosol | Nucleus | |||||
| Expt A |
15 peptides |
46 spectra |
|
0.000 0.000 | 0.000 |
0.000 0.000 | 0.000 |
0.178 0.174 | 0.181 |
0.000 0.000 | 0.000 |
0.256 0.252 | 0.259 |
0.000 0.000 | 0.000 |
0.566 0.563 | 0.569 |
0.000 0.000 | 0.000 |
| 4 spectra, NLVELAELELK | 0.000 | 0.000 | 0.170 | 0.089 | 0.197 | 0.000 | 0.545 | 0.000 | ||
| 3 spectra, TVAMHEVFLCR | 0.000 | 0.000 | 0.227 | 0.099 | 0.187 | 0.000 | 0.487 | 0.000 | ||
| 4 spectra, SLVDYENANK | 0.000 | 0.000 | 0.203 | 0.000 | 0.280 | 0.000 | 0.517 | 0.000 | ||
| 1 spectrum, ISDLLK | 0.000 | 0.007 | 0.131 | 0.000 | 0.316 | 0.000 | 0.547 | 0.000 | ||
| 1 spectrum, SADGVIVSGVK | 0.000 | 0.052 | 0.000 | 0.165 | 0.110 | 0.000 | 0.673 | 0.000 | ||
| 2 spectra, TFLLEYHNR | 0.183 | 0.112 | 0.040 | 0.000 | 0.173 | 0.000 | 0.493 | 0.000 | ||
| 3 spectra, SAADDYNR | 0.000 | 0.000 | 0.165 | 0.000 | 0.295 | 0.000 | 0.540 | 0.000 | ||
| 2 spectra, VSADEDLK | 0.000 | 0.000 | 0.148 | 0.000 | 0.242 | 0.000 | 0.610 | 0.000 | ||
| 2 spectra, QELIDFK | 0.000 | 0.000 | 0.120 | 0.000 | 0.218 | 0.086 | 0.577 | 0.000 | ||
| 4 spectra, VSELFDK | 0.000 | 0.003 | 0.148 | 0.000 | 0.289 | 0.000 | 0.559 | 0.000 | ||
| 2 spectra, SSLPNFK | 0.000 | 0.014 | 0.091 | 0.000 | 0.071 | 0.116 | 0.708 | 0.000 | ||
| 2 spectra, QNEFSVVR | 0.000 | 0.150 | 0.000 | 0.117 | 0.000 | 0.106 | 0.626 | 0.000 | ||
| 4 spectra, VAAHPILR | 0.000 | 0.000 | 0.173 | 0.000 | 0.098 | 0.075 | 0.655 | 0.000 | ||
| 10 spectra, DVDDFFEHER | 0.000 | 0.000 | 0.136 | 0.069 | 0.223 | 0.000 | 0.571 | 0.000 | ||
| 2 spectra, LEDFFK | 0.000 | 0.115 | 0.109 | 0.015 | 0.145 | 0.050 | 0.565 | 0.000 |
| Plot | Mito | Lyso or Perox | ER | Golgi | PM | Cytosol | Nucleus | ||||||
| Expt B |
4 peptides |
10 spectra |
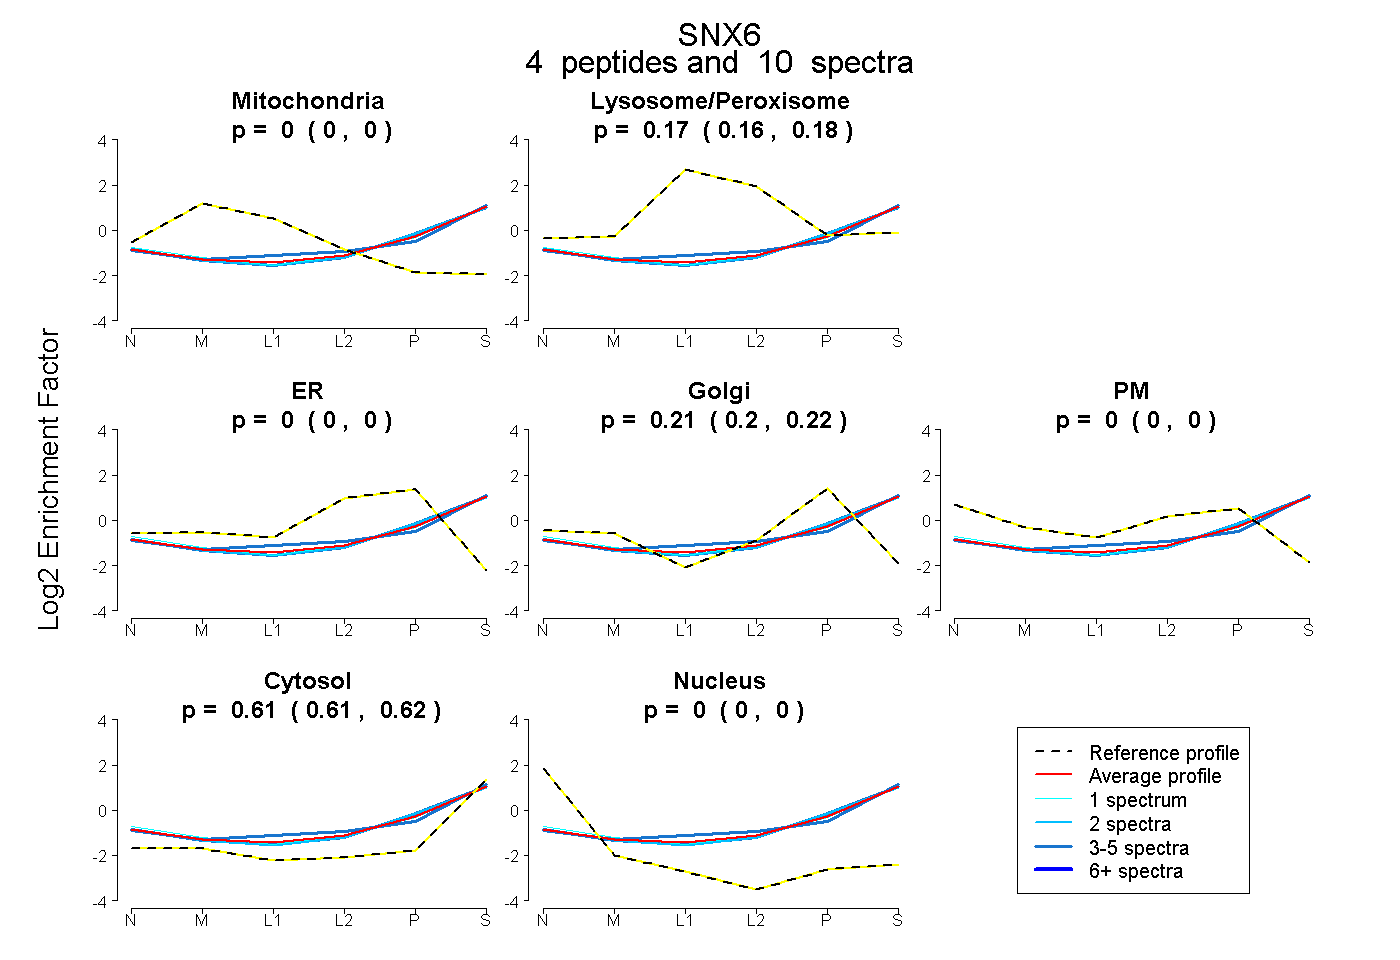 |
0.000 0.000 | 0.000 |
0.172 0.161 | 0.181 |
0.000 0.000 | 0.000 |
0.214 0.203 | 0.223 |
0.000 0.000 | 0.000 |
0.614 0.605 | 0.621 |
0.000 0.000 | 0.000 |
|||
| Plot | Lyso | Other | |||||||||||
| Expt C |
17 peptides |
51 spectra |
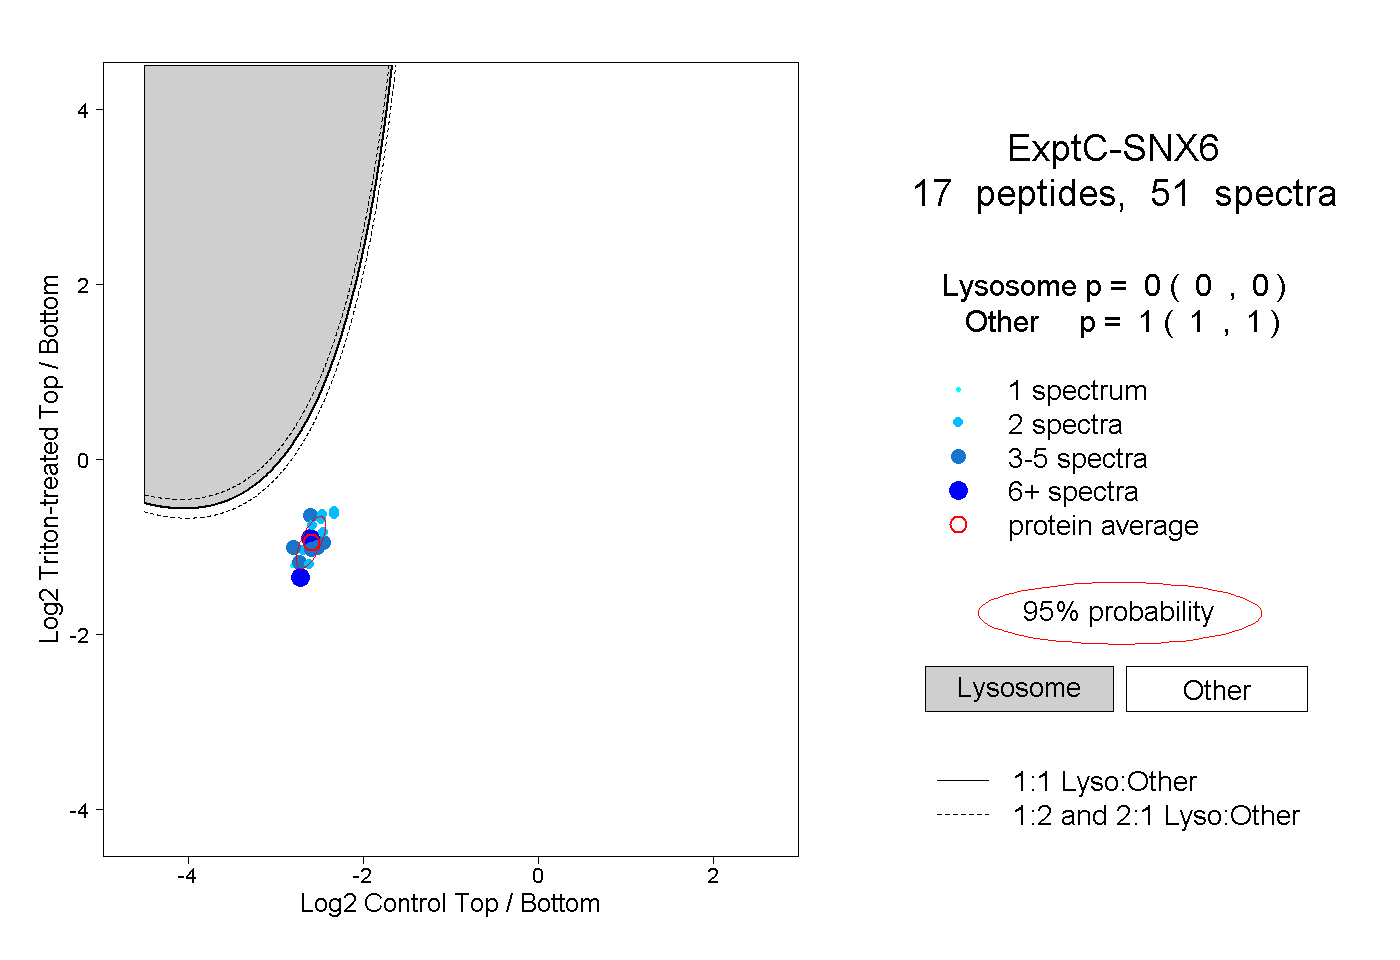 |
0.000 0.000 | 0.000 |
1.000 1.000 | 1.000 |
||||||||
| Plot | Lyso | Other | |||||||||||
| Expt D |
6 peptides |
11 spectra |
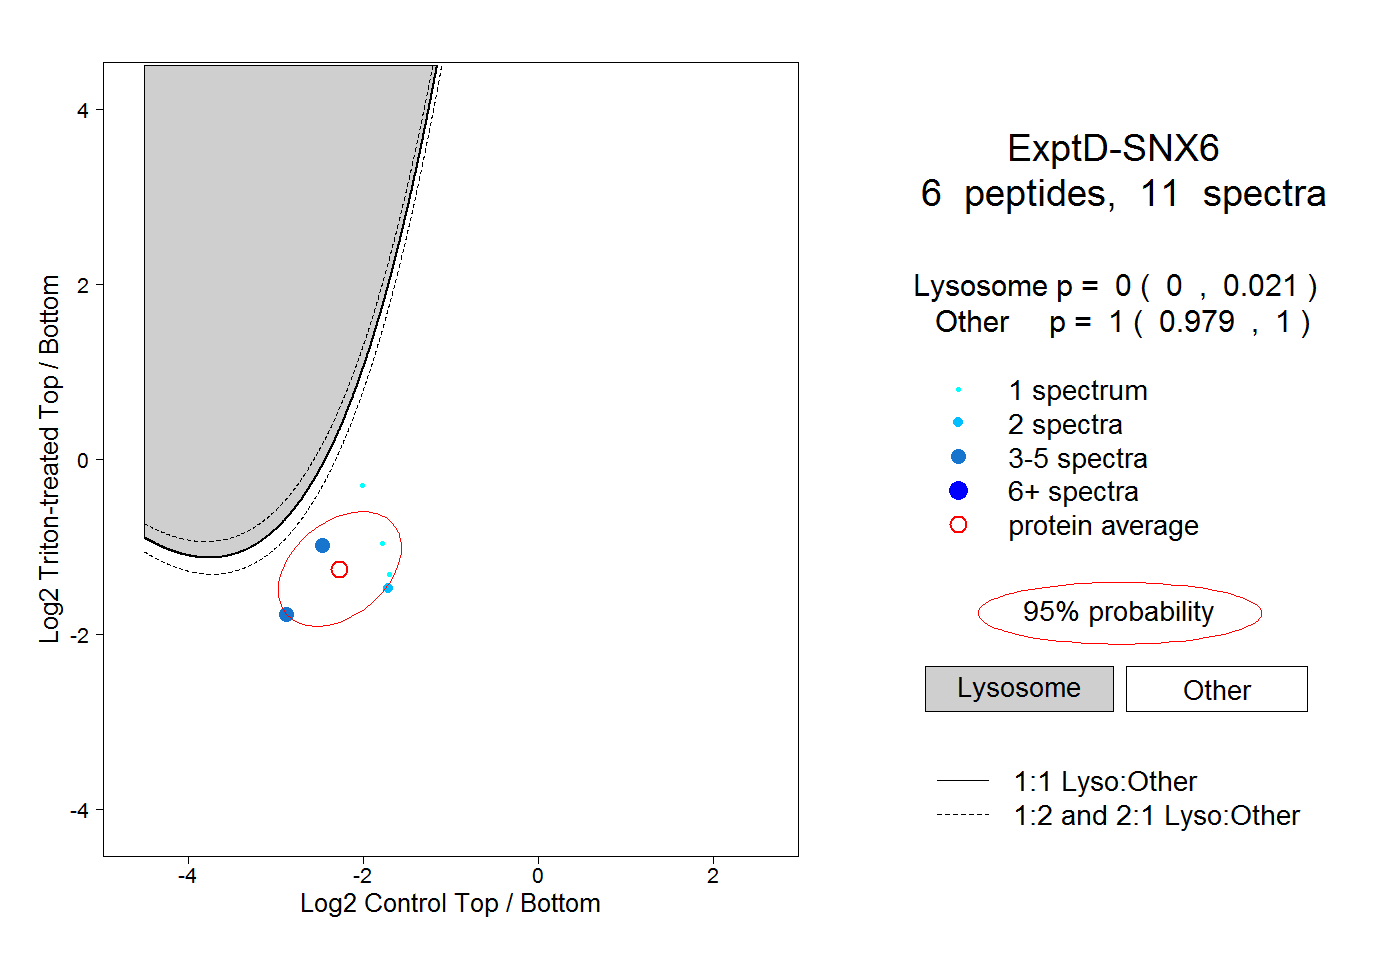 |
0.000 0.000 | 0.021 |
1.000 0.979 | 1.000 |