 10
10peptides
spectra
0.948 | 0.952
0.000 | 0.000
0.000 | 0.000
0.000 | 0.000
0.000 | 0.000
0.000 | 0.000
0.000 | 0.000
0.048 | 0.051
| Plot | Mito | Lyso | Perox | ER | Golgi | PM | Cytosol | Nucleus | |||||
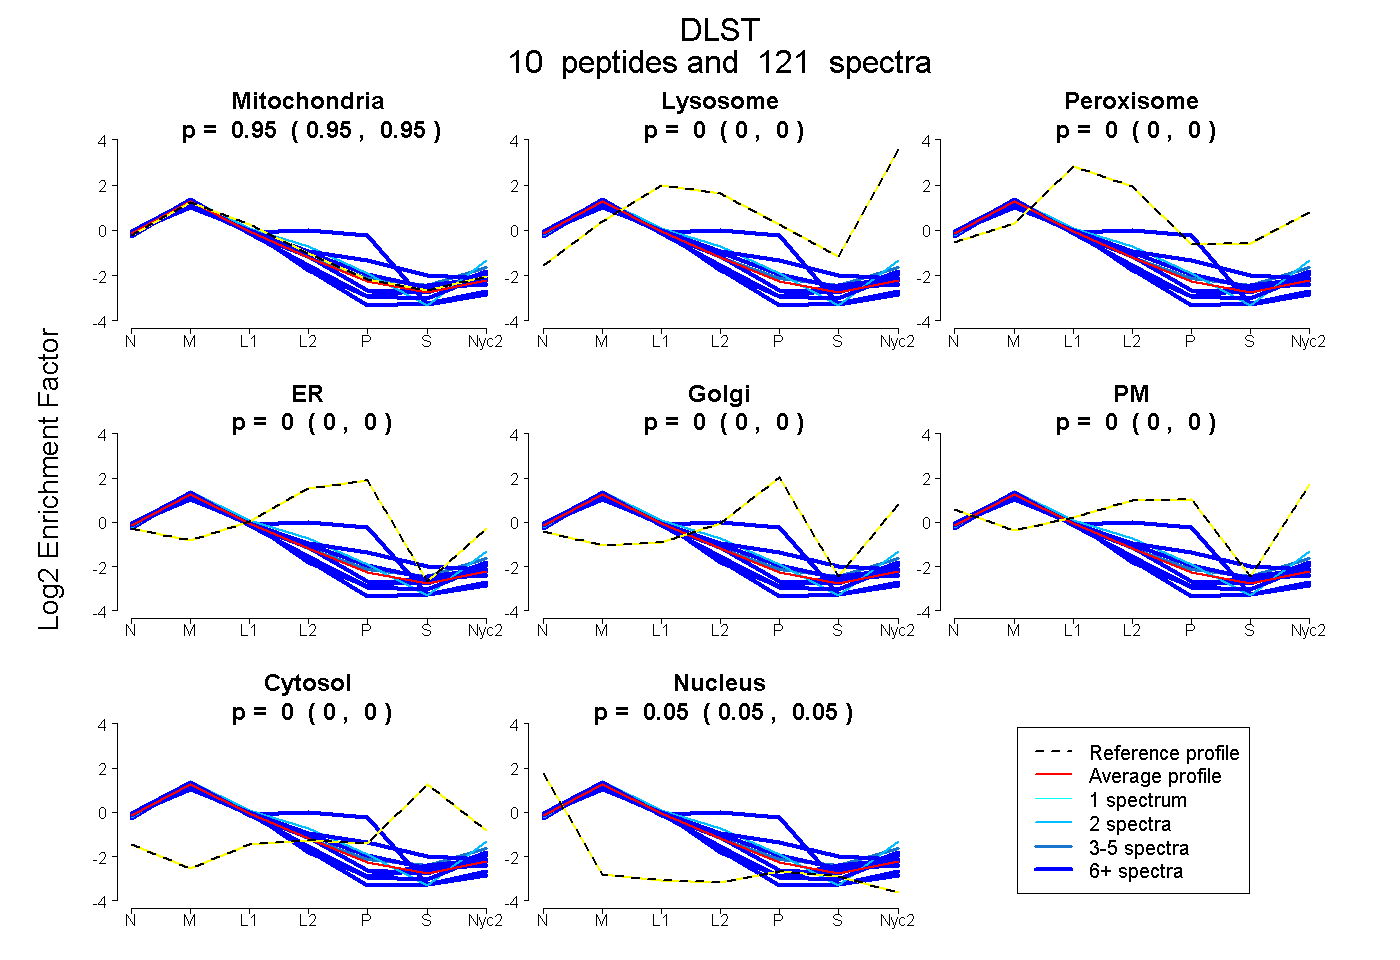
| Expt A |
10 peptides |
121 spectra |
|
0.950 0.948 | 0.952 |
0.000 0.000 | 0.000 |
0.000 0.000 | 0.000 |
0.000 0.000 | 0.000 |
0.000 0.000 | 0.000 |
0.000 0.000 | 0.000 |
0.000 0.000 | 0.000 |
0.050 0.048 | 0.051 |
| 16 spectra, EAVTFLR | 0.925 | 0.000 | 0.000 | 0.000 | 0.000 | 0.000 | 0.000 | 0.075 | ||
| 7 spectra, DYIDISVAVATPR | 0.911 | 0.000 | 0.000 | 0.000 | 0.000 | 0.000 | 0.000 | 0.089 | ||
| 6 spectra, VEVRPMMYVALTYDHR | 0.813 | 0.000 | 0.000 | 0.098 | 0.000 | 0.000 | 0.077 | 0.012 | ||
| 18 spectra, NVETMNYADIER | 0.965 | 0.000 | 0.000 | 0.000 | 0.000 | 0.000 | 0.000 | 0.035 | ||
| 5 spectra, AAVEDPR | 0.911 | 0.037 | 0.000 | 0.000 | 0.000 | 0.000 | 0.019 | 0.034 | ||
| 12 spectra, VEGGTPLFTLR | 0.934 | 0.000 | 0.000 | 0.000 | 0.000 | 0.000 | 0.000 | 0.066 | ||
| 2 spectra, TINELGEK | 0.882 | 0.000 | 0.000 | 0.000 | 0.000 | 0.118 | 0.000 | 0.000 | ||
| 20 spectra, LGFMSAFVK | 0.953 | 0.000 | 0.000 | 0.013 | 0.000 | 0.000 | 0.002 | 0.032 | ||
| 29 spectra, GLVVPVIR | 0.893 | 0.000 | 0.000 | 0.000 | 0.000 | 0.000 | 0.000 | 0.107 | ||
| 6 spectra, TGAAPAK | 0.667 | 0.000 | 0.000 | 0.310 | 0.000 | 0.000 | 0.000 | 0.023 |
| Plot | Mito | Lyso or Perox | ER | Golgi | PM | Cytosol | Nucleus | ||||||
| Expt B |
9 peptides |
60 spectra |
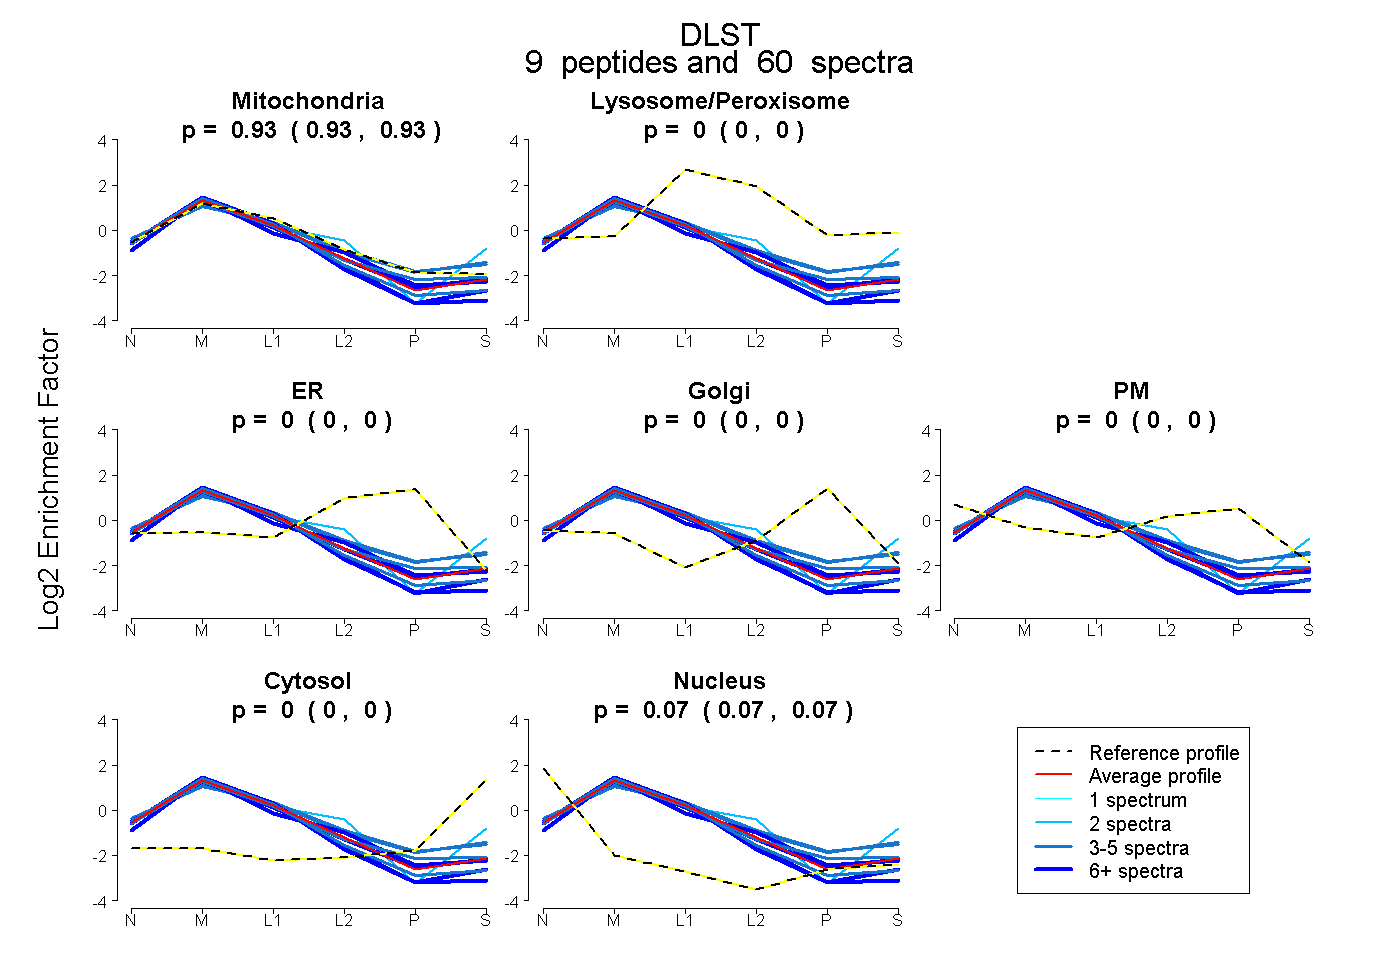 |
0.930 0.926 | 0.932 |
0.000 0.000 | 0.000 |
0.000 0.000 | 0.000 |
0.000 0.000 | 0.000 |
0.000 0.000 | 0.000 |
0.000 0.000 | 0.000 |
0.070 0.067 | 0.074 |
|||
| Plot | Lyso | Other | |||||||||||
| Expt C |
13 peptides |
496 spectra |
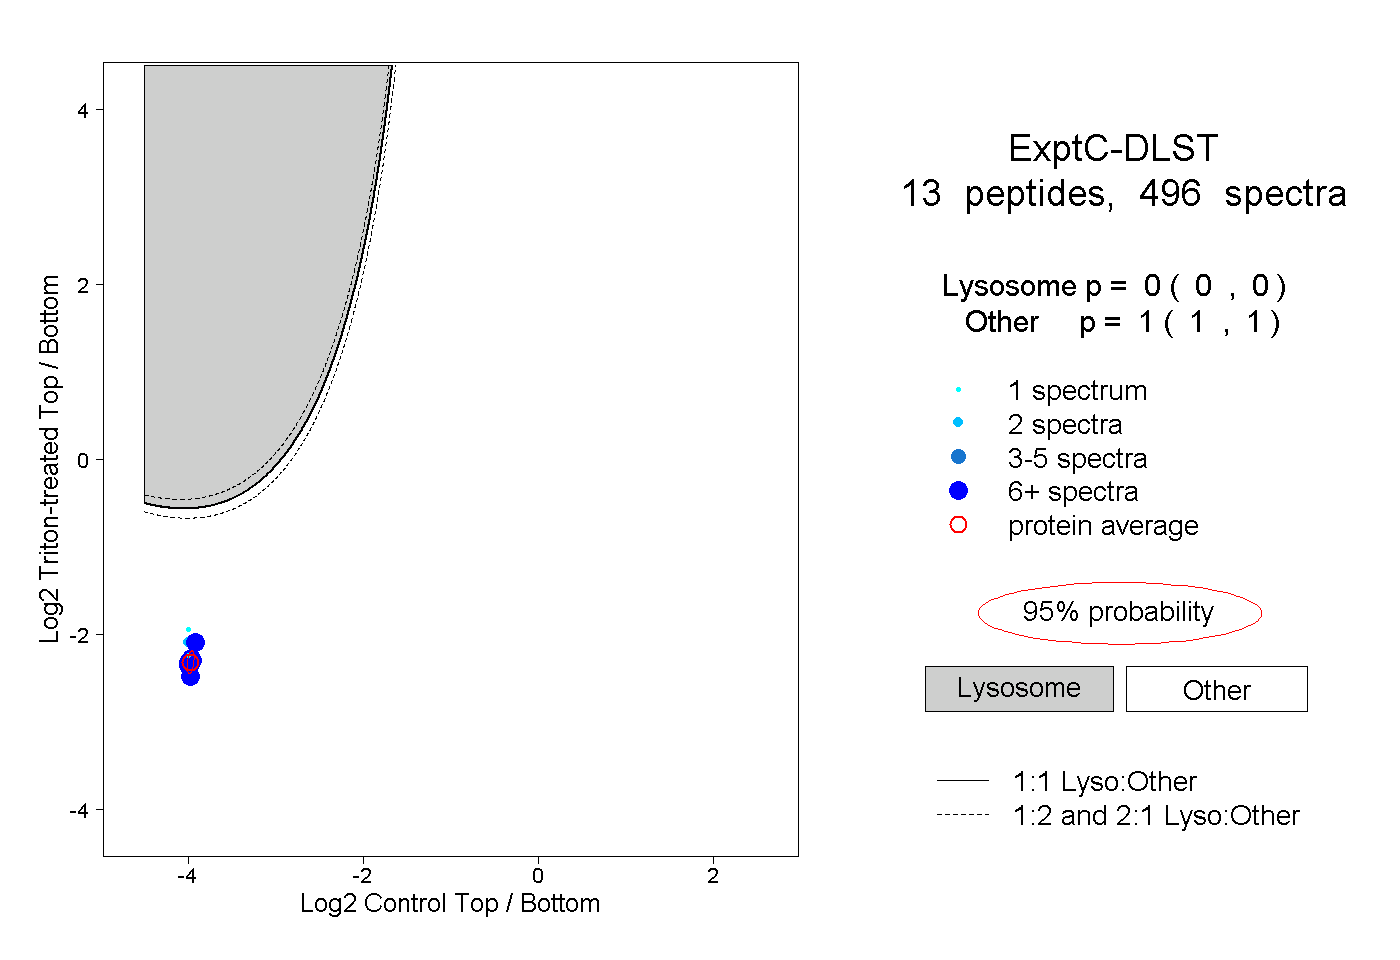 |
0.000 0.000 | 0.000 |
1.000 1.000 | 1.000 |
||||||||
| Plot | Lyso | Other | |||||||||||
| Expt D |
11 peptides |
35 spectra |
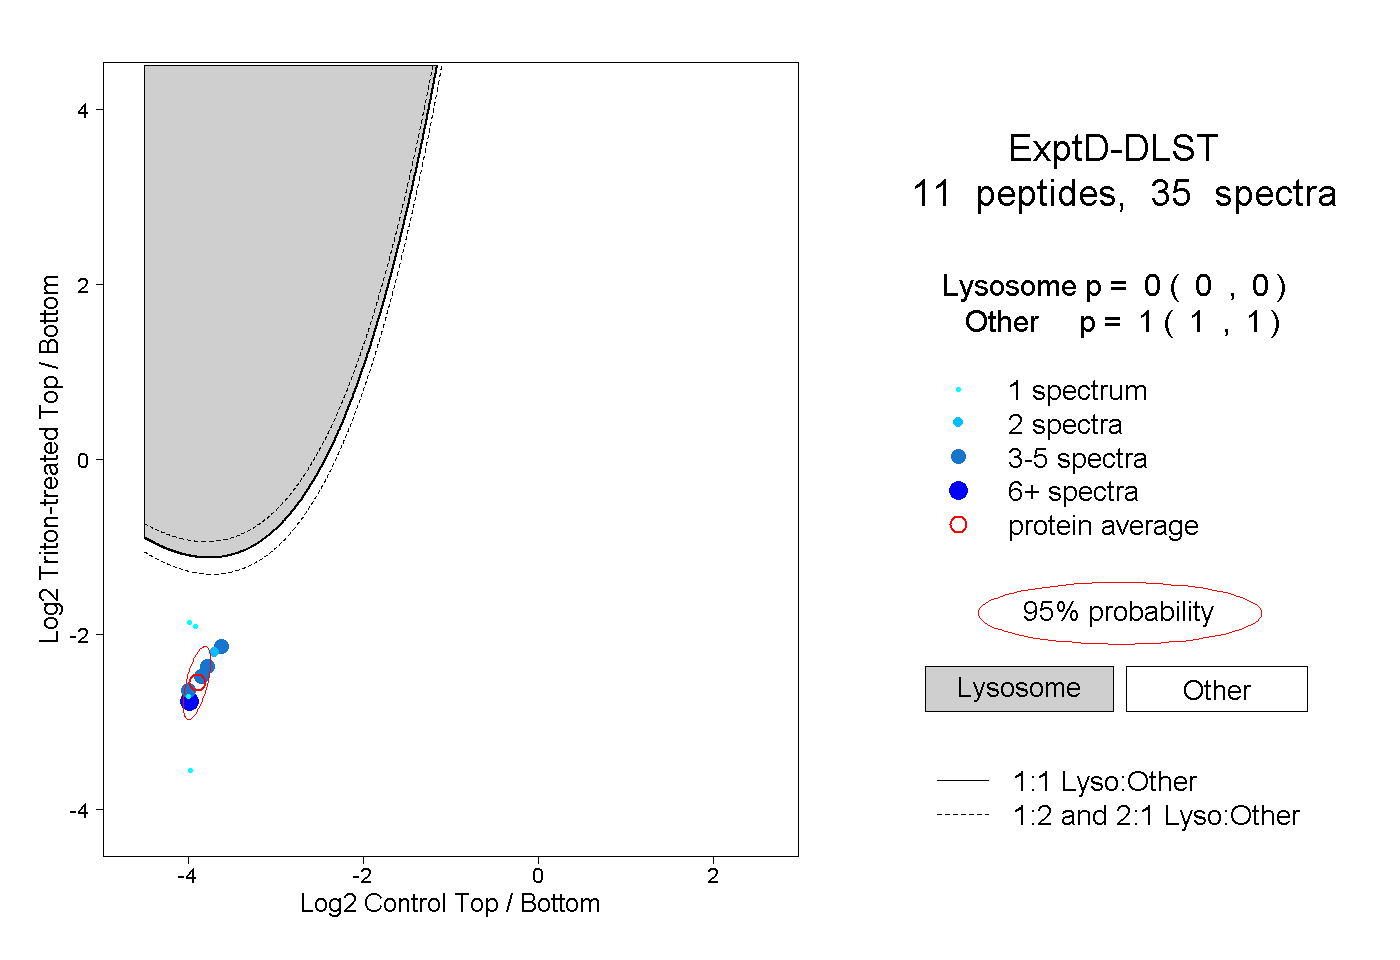 |
0.000 0.000 | 0.000 |
1.000 1.000 | 1.000 |