 2
2peptides
spectra
NA | NA
NA | NA
NA | NA
NA | NA
NA | NA
NA | NA
NA | NA
NA | NA
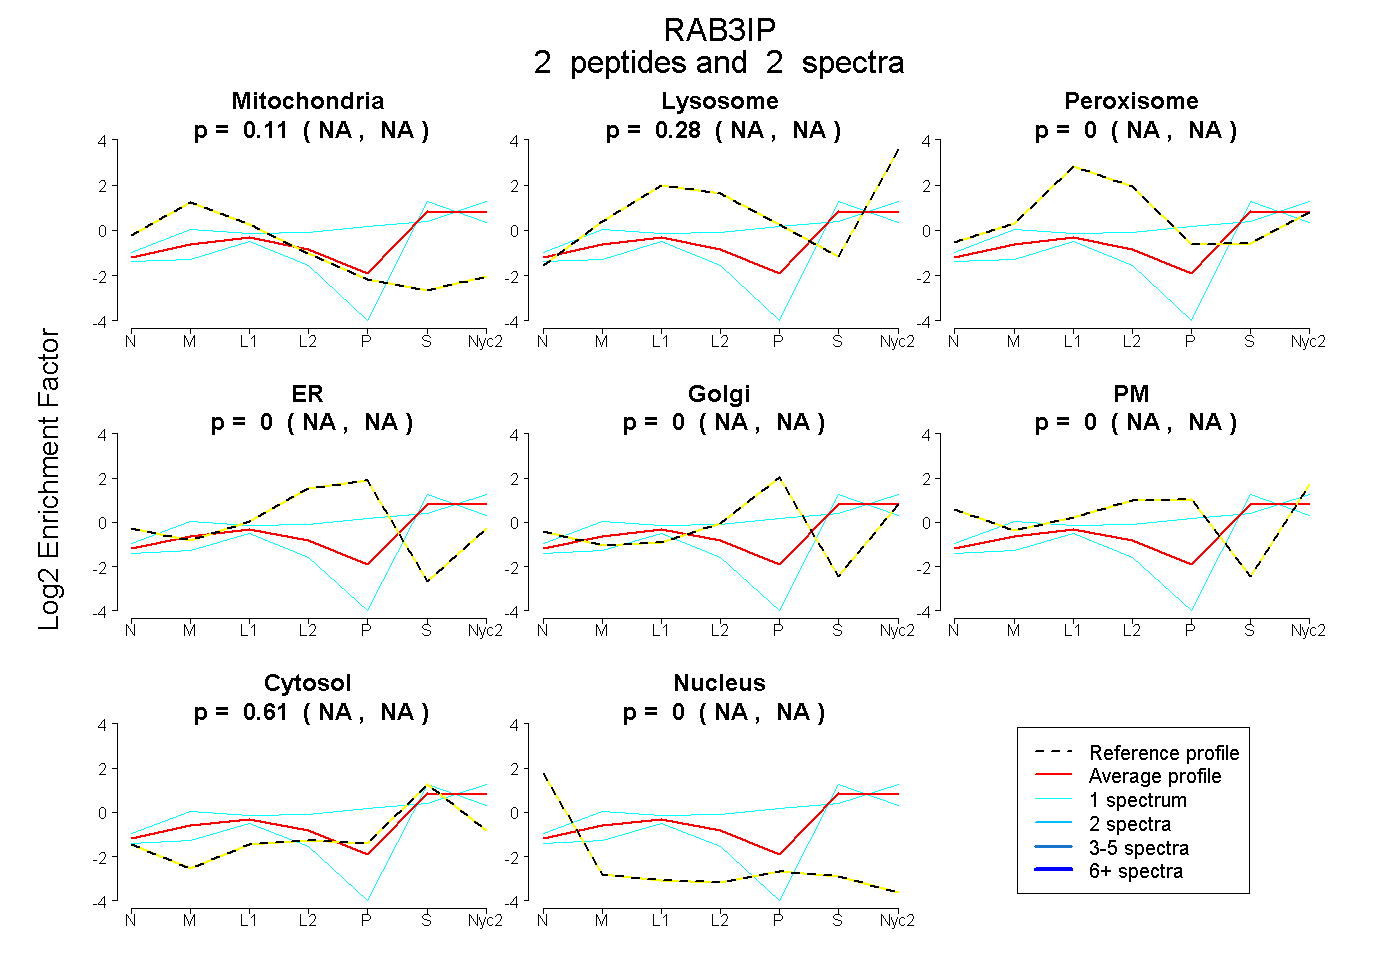
| Plot | Mito | Lyso | Perox | ER | Golgi | PM | Cytosol | Nucleus | |||||
| Expt A |
2 peptides |
2 spectra |
|
0.113 NA | NA |
0.279 NA | NA |
0.000 NA | NA |
0.000 NA | NA |
0.000 NA | NA |
0.000 NA | NA |
0.608 NA | NA |
0.000 NA | NA |
| 1 spectrum, IDVLQAEVAALK | 0.158 | 0.064 | 0.000 | 0.000 | 0.000 | 0.000 | 0.777 | 0.000 | ||
| 1 spectrum, IYQEDIFPCLTFAK | 0.039 | 0.435 | 0.000 | 0.000 | 0.125 | 0.000 | 0.401 | 0.000 |