SDC2
[ENSRNOP00000007255]
Main page
| | | Plot |
Mito |
Lyso |
|
Perox |
ER |
Golgi |
PM |
Cytosol |
Nucleus |
|
| Expt A |
 6
6
peptides |
17
spectra |
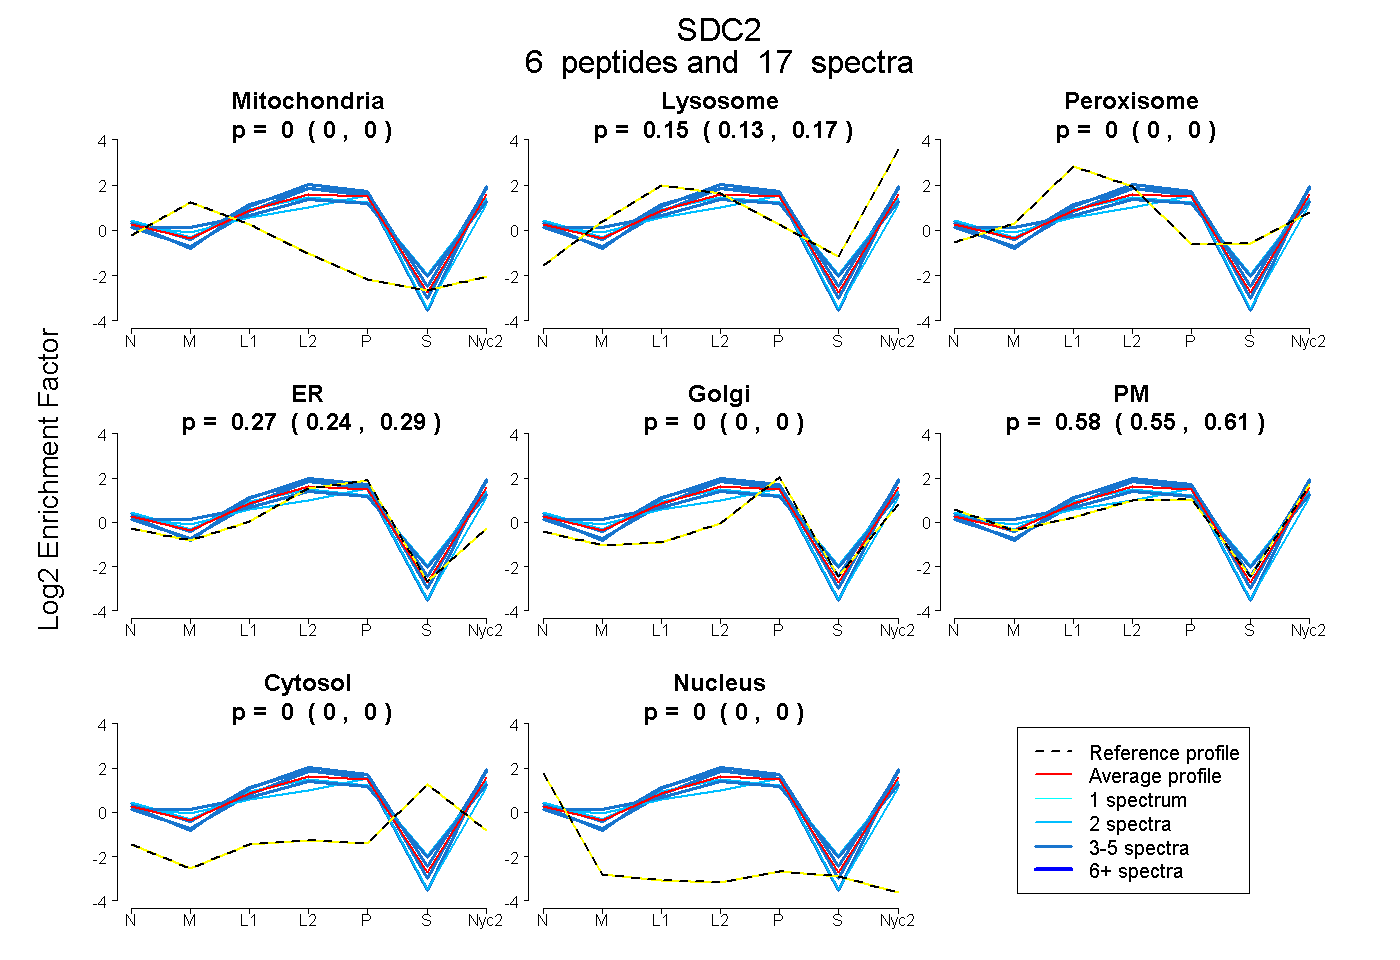 |
0.000
0.000 | 0.000 |
0.151
0.135 | 0.165 |
|
0.000
0.000 | 0.000 |
0.270
0.245 | 0.290 |
0.000
0.000 | 0.000 |
0.579
0.549 | 0.606 |
0.000
0.000 | 0.000 |
0.000
0.000 | 0.000 |
|
| | | Plot |
Mito |
|
Lyso or Perox |
|
ER |
Golgi |
PM |
Cytosol |
Nucleus |
|
| Expt B |
4
peptides |
5
spectra |
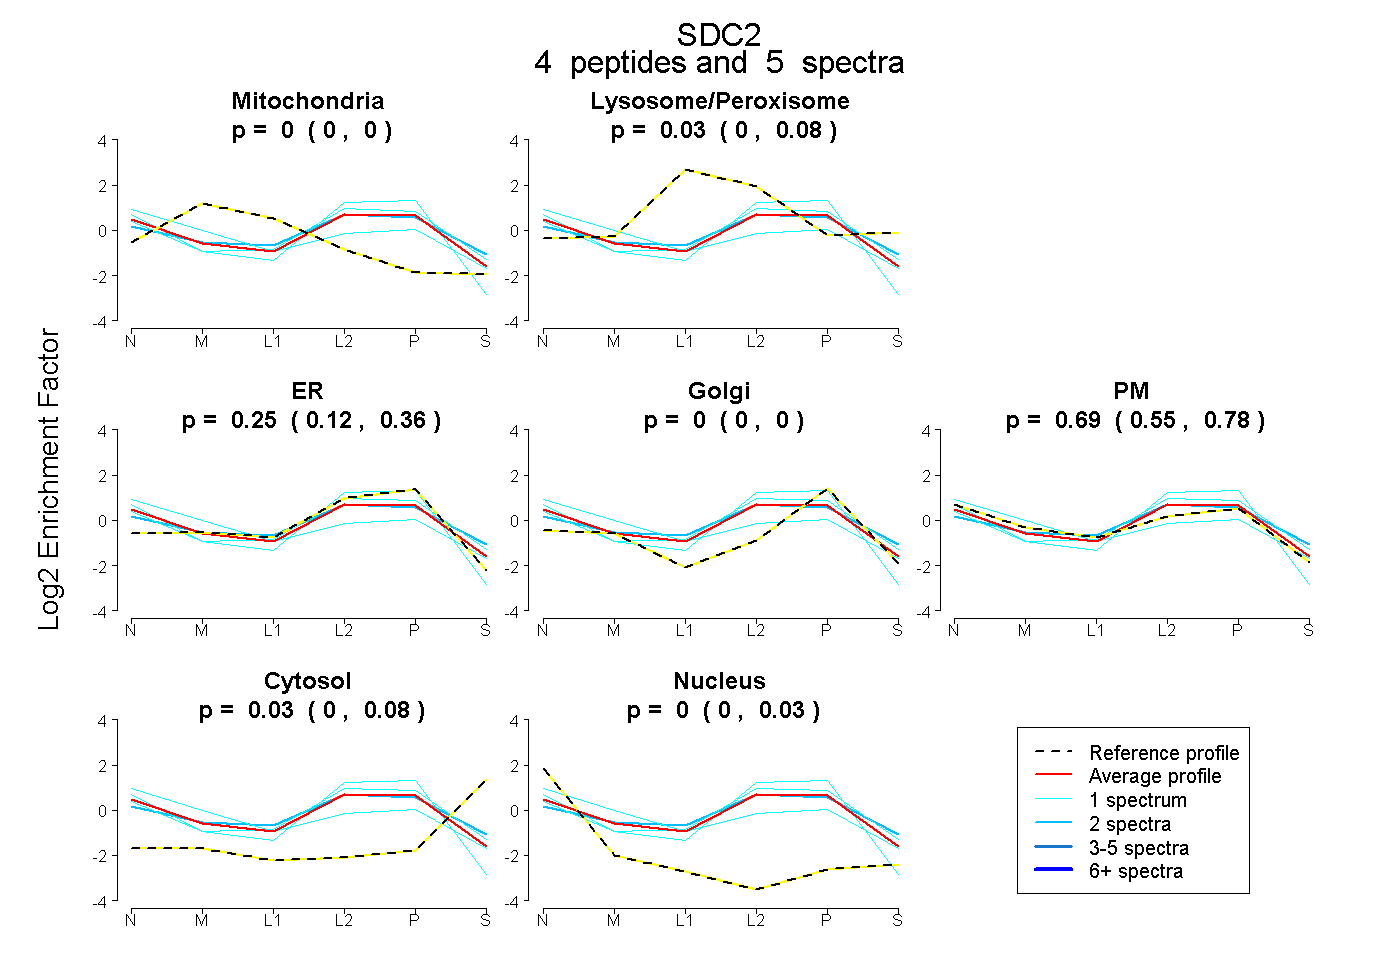 |
0.000
0.000 | 0.000 |
|
0.034
0.000 | 0.083 |
|
0.248
0.118 | 0.362 |
0.000
0.000 | 0.000 |
0.689
0.545 | 0.785 |
0.030
0.000 | 0.077 |
0.000
0.000 | 0.029 |
|
| 1 spectrum, HSDNLFK |
0.089 |
|
0.000 |
|
0.000 |
0.000 |
0.840 |
0.000 |
0.071 |
|
| 2 spectra, DEGSYDLGER |
0.000 |
|
0.136 |
|
0.273 |
0.000 |
0.488 |
0.102 |
0.000 |
|
| 1 spectrum, STDVYTEK |
0.000 |
|
0.076 |
|
0.249 |
0.000 |
0.656 |
0.019 |
0.000 |
|
| 1 spectrum, EFEISEAEEK |
0.000 |
|
0.000 |
|
0.826 |
0.000 |
0.128 |
0.000 |
0.046 |
|
| | | Plot |
|
Lyso |
|
|
|
|
|
|
|
Other |
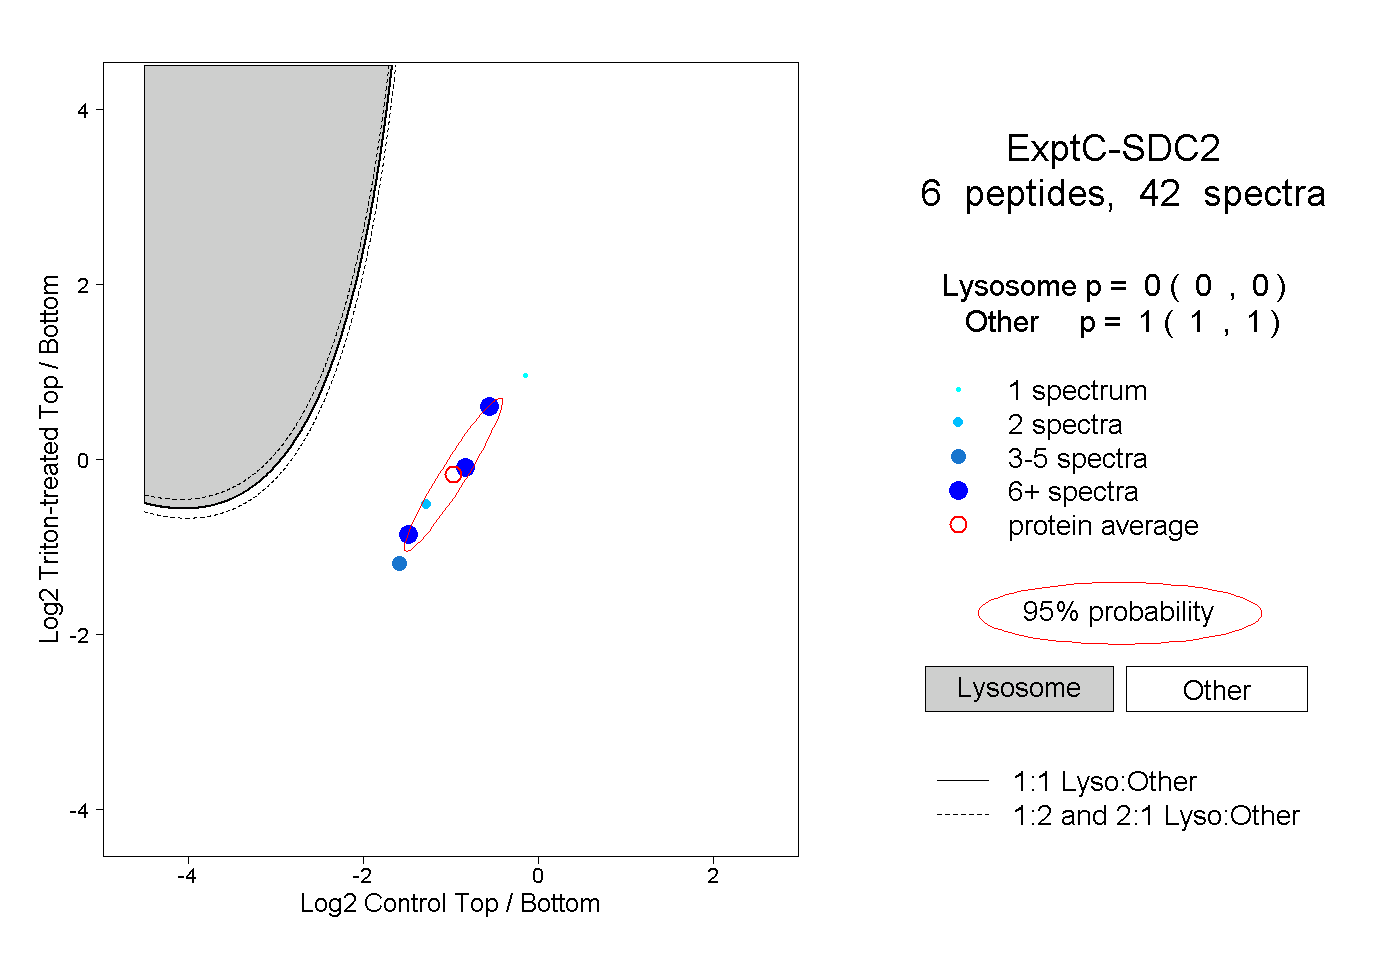
| Expt C |
6
peptides |
42
spectra |
 |
|
0.000
0.000 | 0.000 |
|
|
|
|
|
|
|
1.000
1.000 | 1.000 |
| | | Plot |
|
Lyso |
|
|
|
|
|
|
|
Other |
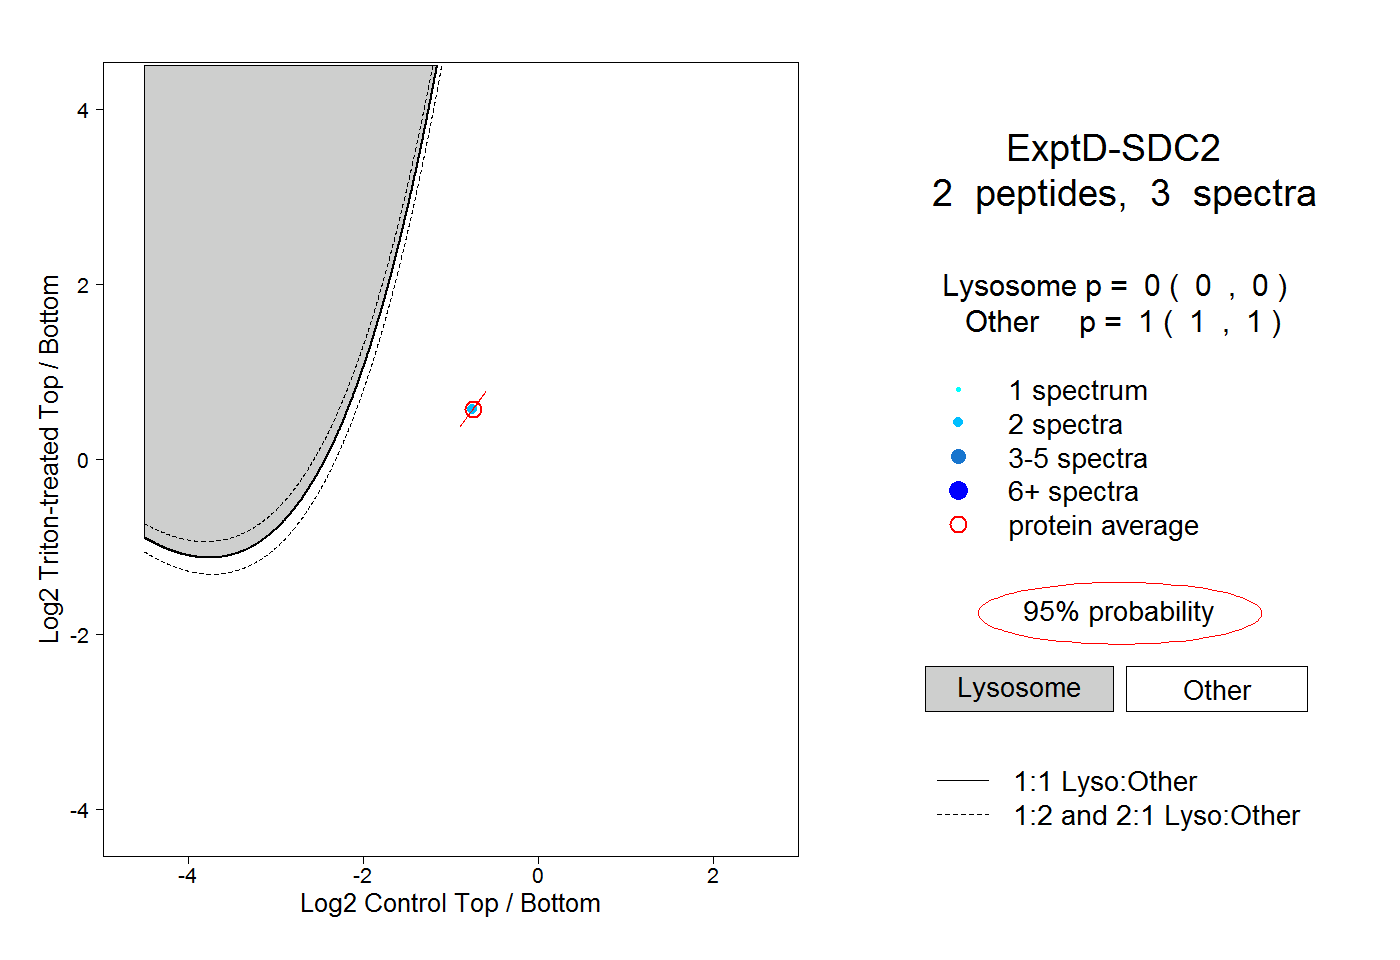
| Expt D |
2
peptides |
3
spectra |
 |
|
0.000
0.000 | 0.000 |
|
|
|
|
|
|
|
1.000
1.000 | 1.000 |