 4
4peptides
spectra
0.000 | 0.000
0.499 | 0.614
0.000 | 0.000
0.000 | 0.027
0.000 | 0.189
0.065 | 0.281
0.115 | 0.188
0.000 | 0.000
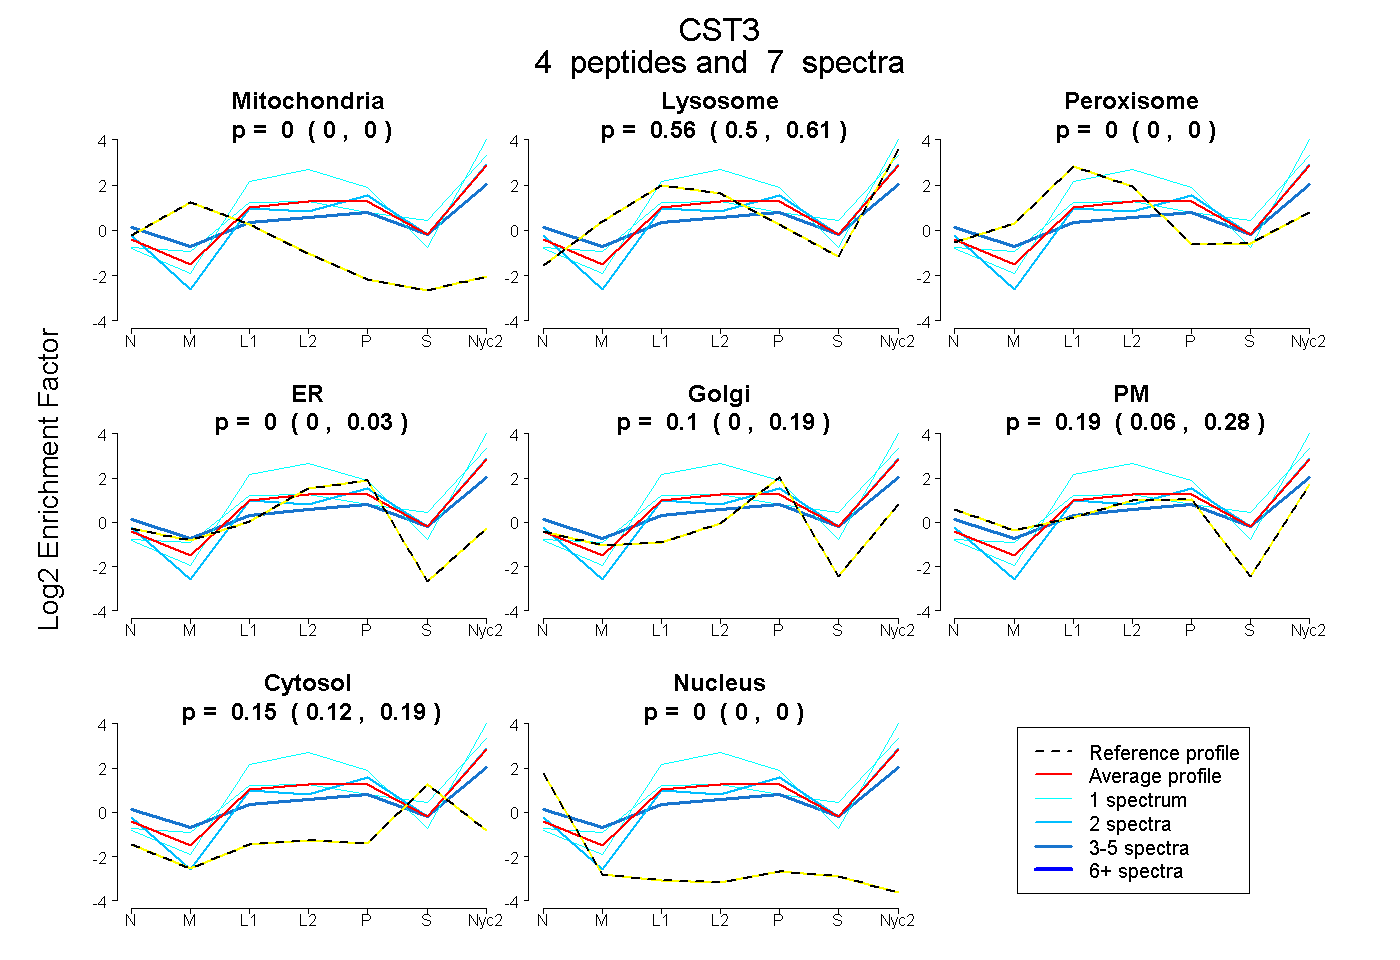
| Plot | Mito | Lyso | Perox | ER | Golgi | PM | Cytosol | Nucleus | |||||
| Expt A |
4 peptides |
7 spectra |
|
0.000 0.000 | 0.000 |
0.560 0.499 | 0.614 |
0.000 0.000 | 0.000 |
0.000 0.000 | 0.027 |
0.097 0.000 | 0.189 |
0.189 0.065 | 0.281 |
0.154 0.115 | 0.188 |
0.000 0.000 | 0.000 |
| 1 spectrum, ALDFAVSEYNK | 0.000 | 0.785 | 0.000 | 0.000 | 0.000 | 0.014 | 0.201 | 0.000 | ||
| 3 spectra, GSNDAYHSR | 0.000 | 0.301 | 0.000 | 0.000 | 0.000 | 0.456 | 0.244 | 0.000 | ||
| 2 spectra, SQTNLTNCPFHDQPHLMR | 0.000 | 0.473 | 0.000 | 0.000 | 0.242 | 0.102 | 0.183 | 0.000 | ||
| 1 spectrum, LLGAPQEADASEEGVQR | 0.000 | 0.862 | 0.000 | 0.138 | 0.000 | 0.000 | 0.000 | 0.000 |
| Plot | Mito | Lyso or Perox | ER | Golgi | PM | Cytosol | Nucleus | ||||||
| Expt B |
1 peptide |
1 spectrum |
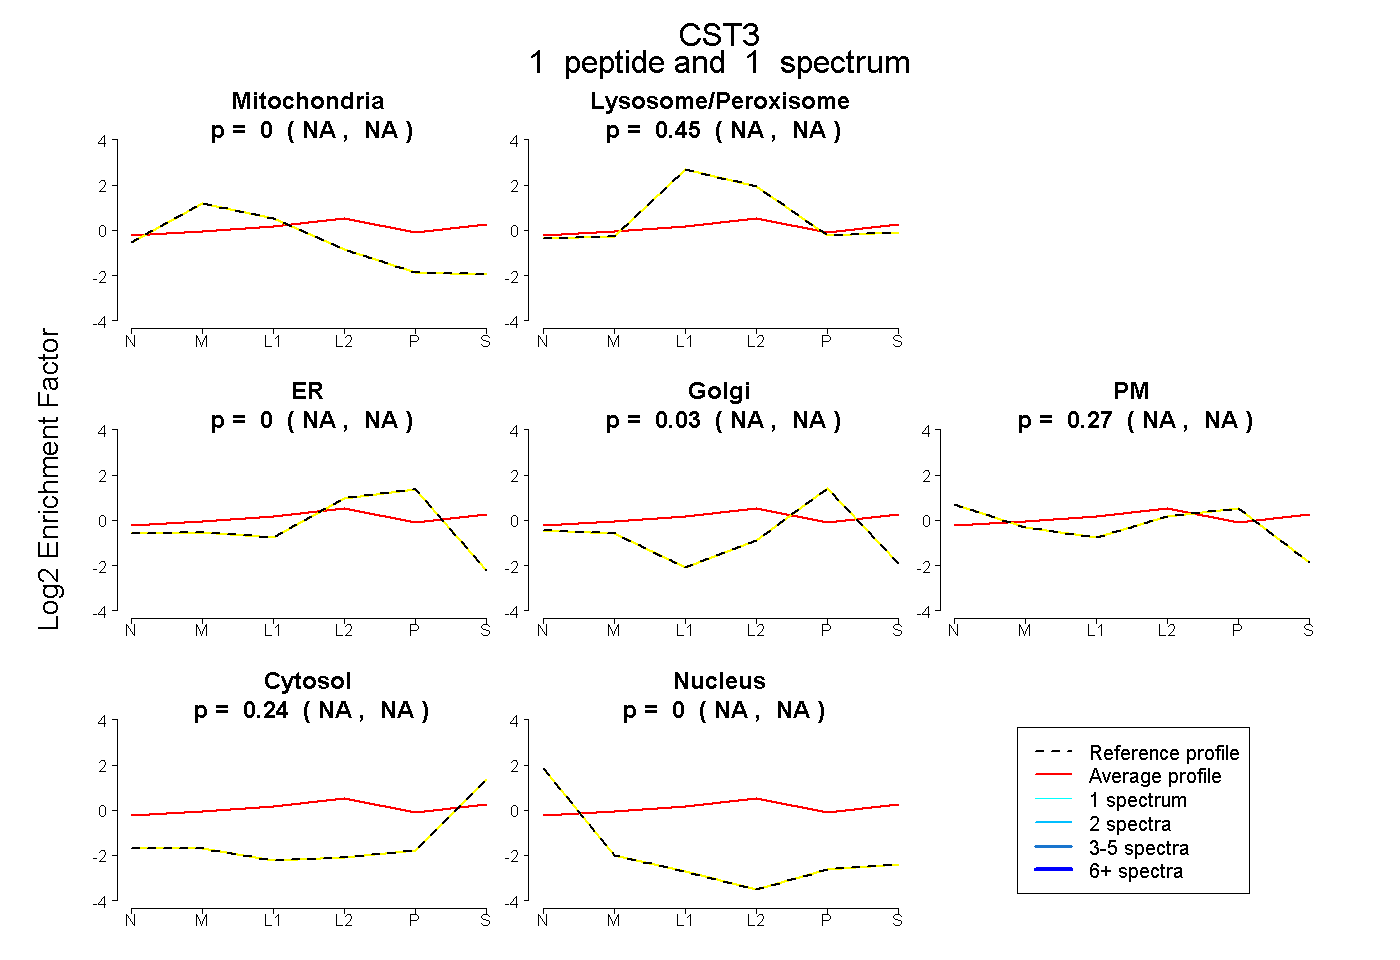 |
0.000 NA | NA |
0.452 NA | NA |
0.000 NA | NA |
0.032 NA | NA |
0.272 NA | NA |
0.244 NA | NA |
0.000 NA | NA |
|||
| Plot | Lyso | Other | |||||||||||
| Expt C |
3 peptides |
7 spectra |
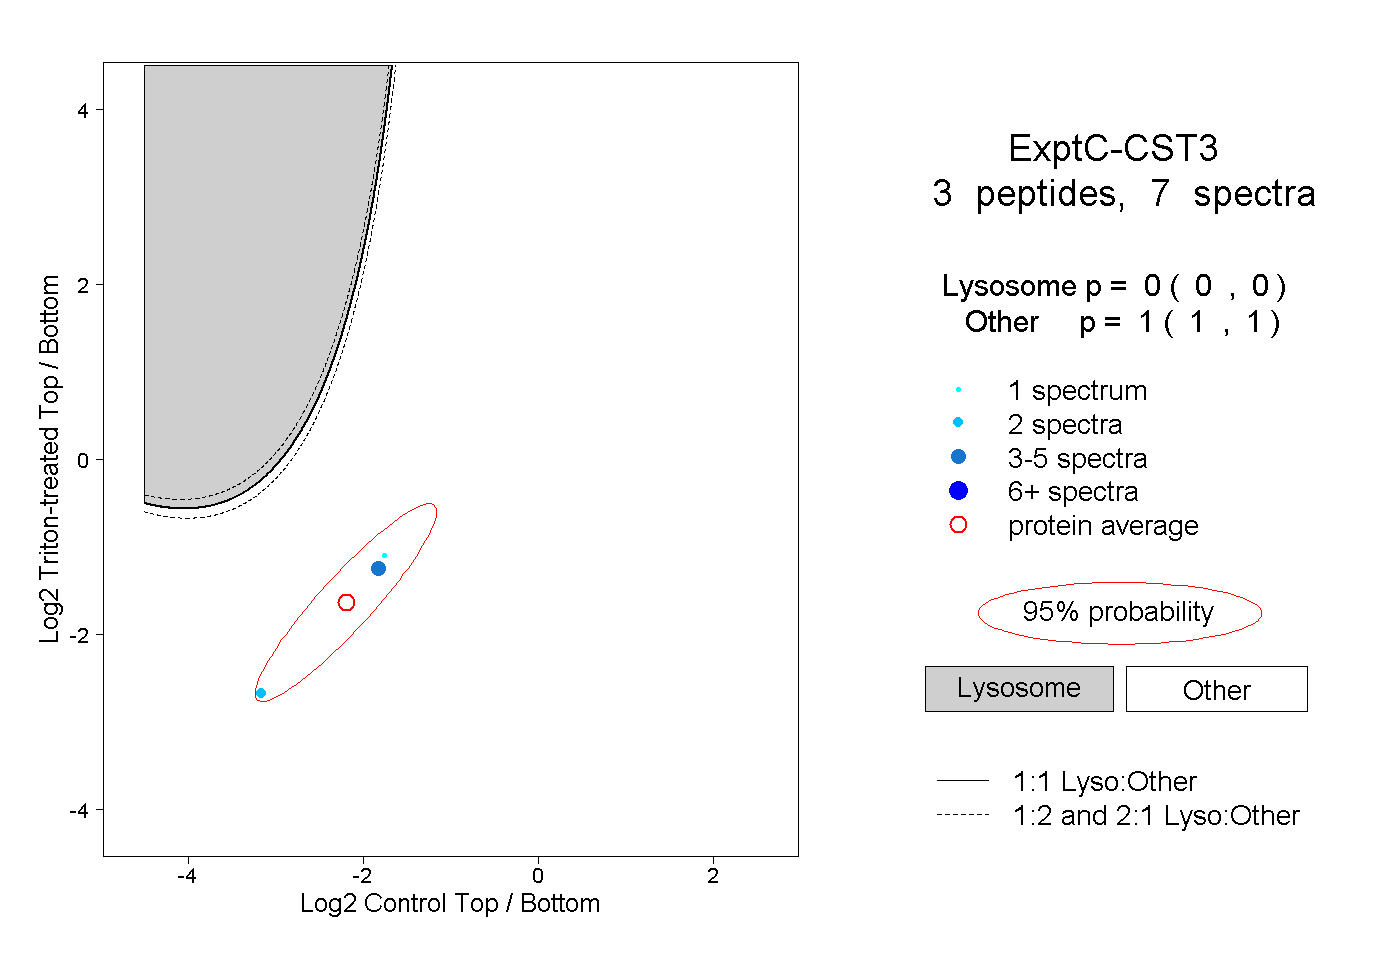 |
0.000 0.000 | 0.000 |
1.000 1.000 | 1.000 |
||||||||
| Plot | Lyso | Other | |||||||||||
| Expt D |
1 peptide |
2 spectra |
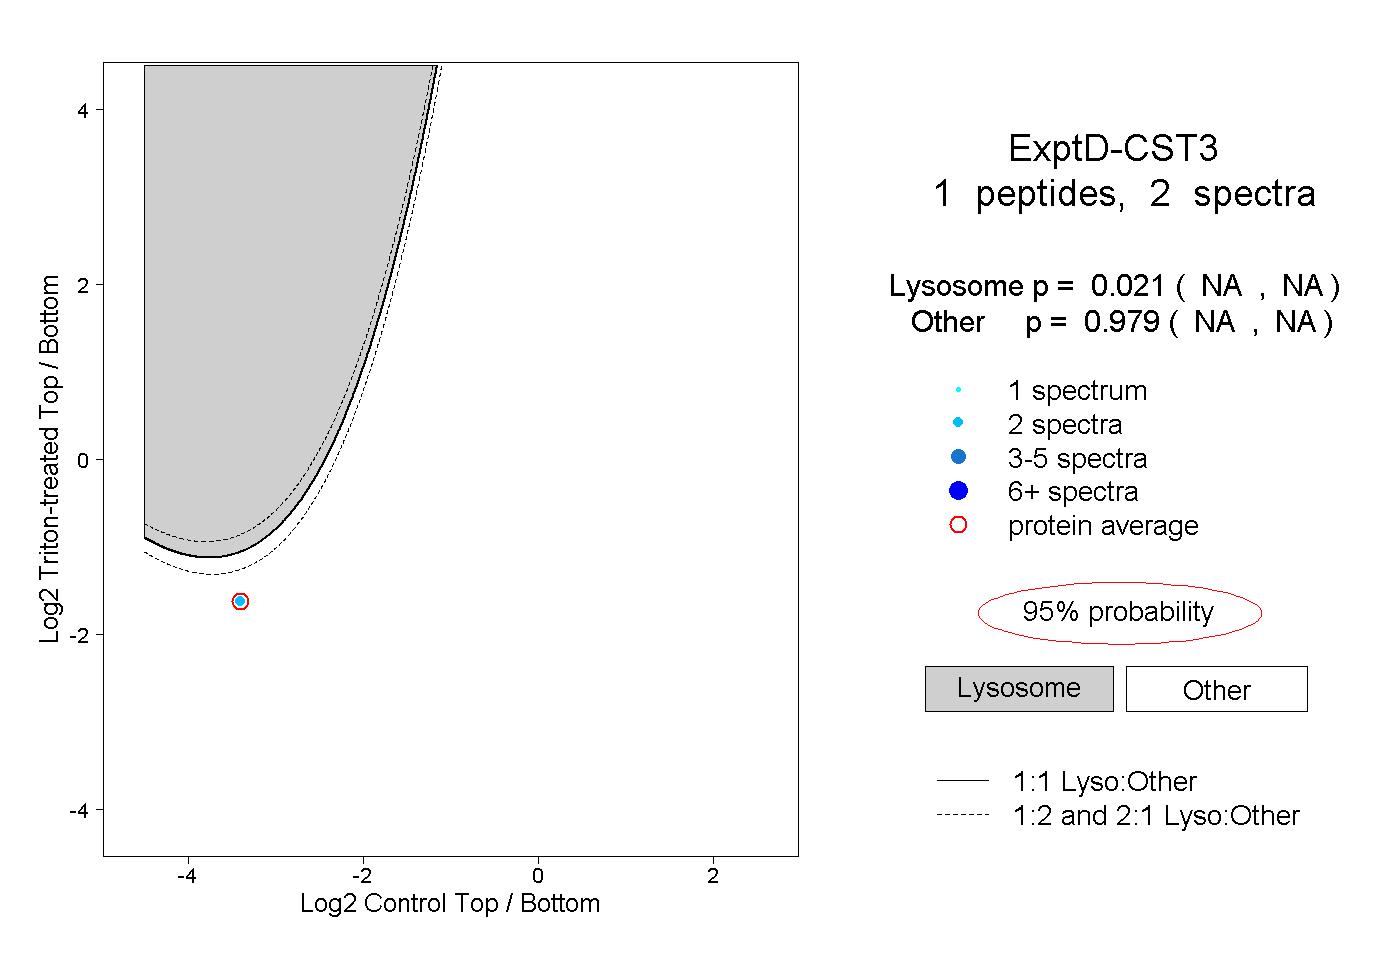 |
0.021 NA | NA |
0.979 NA | NA |