 4
4peptides
spectra
0.448 | 0.502
0.000 | 0.038
0.054 | 0.125
0.174 | 0.289
0.000 | 0.000
0.113 | 0.226
0.000 | 0.000
0.000 | 0.000
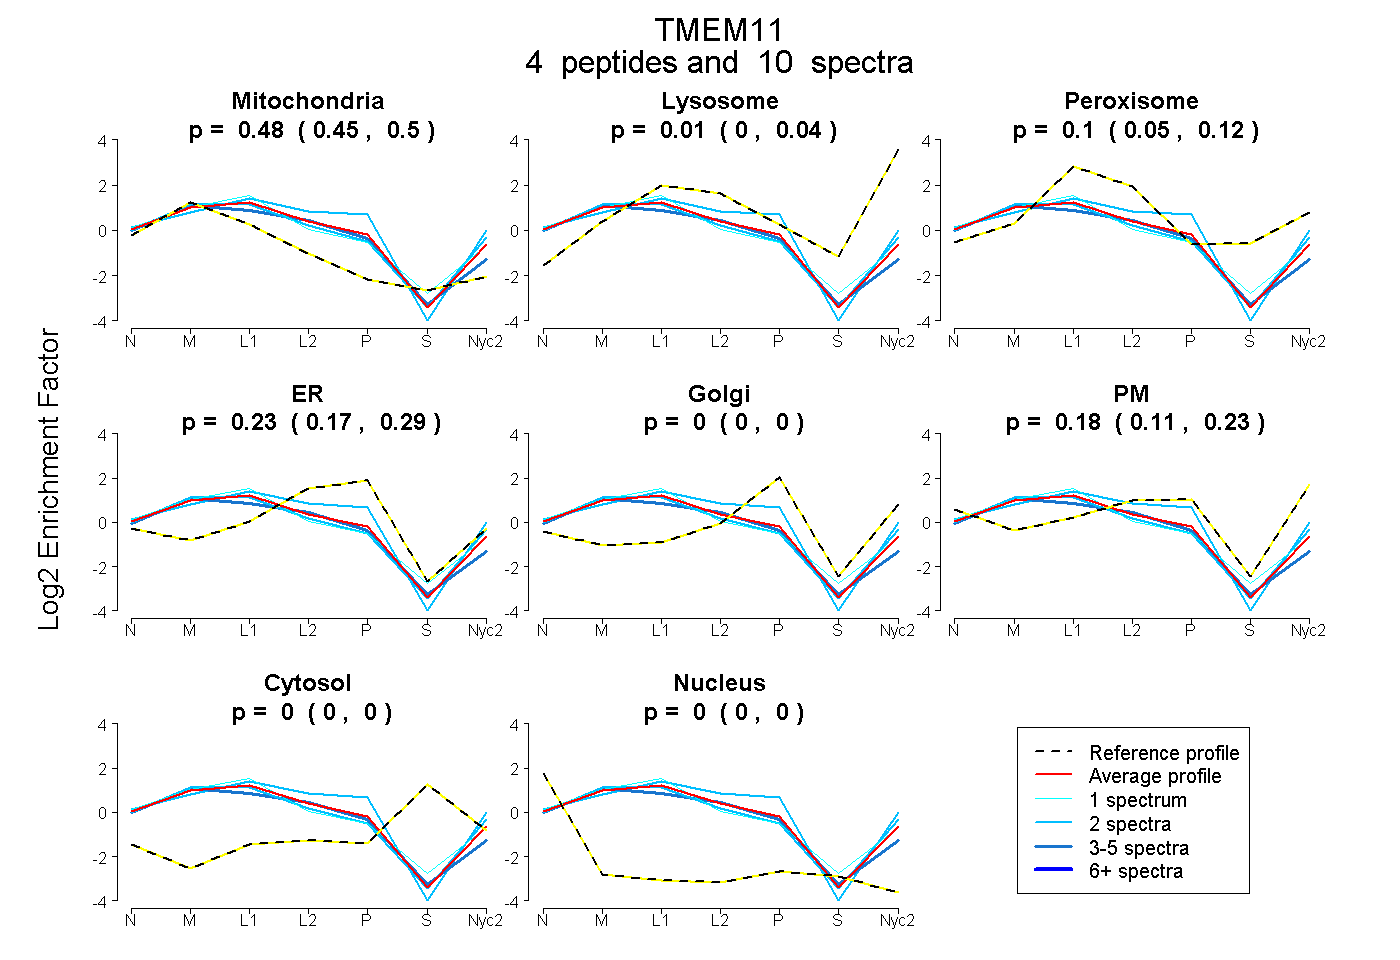
| Plot | Mito | Lyso | Perox | ER | Golgi | PM | Cytosol | Nucleus | |||||
| Expt A |
4 peptides |
10 spectra |
|
0.476 0.448 | 0.502 |
0.009 0.000 | 0.038 |
0.098 0.054 | 0.125 |
0.233 0.174 | 0.289 |
0.000 0.000 | 0.000 |
0.184 0.113 | 0.226 |
0.000 0.000 | 0.000 |
0.000 0.000 | 0.000 |
| 5 spectra, WITVGNCLHK | 0.562 | 0.000 | 0.067 | 0.371 | 0.000 | 0.000 | 0.000 | 0.000 | ||
| 1 spectrum, YQVEYDAYK | 0.520 | 0.000 | 0.217 | 0.078 | 0.000 | 0.185 | 0.000 | 0.000 | ||
| 2 spectra, YIVIEPTR | 0.539 | 0.095 | 0.011 | 0.090 | 0.000 | 0.265 | 0.000 | 0.000 | ||
| 2 spectra, LPLHTLTSSTPVVLVR | 0.292 | 0.060 | 0.008 | 0.356 | 0.000 | 0.284 | 0.000 | 0.000 |
| Plot | Mito | Lyso or Perox | ER | Golgi | PM | Cytosol | Nucleus | ||||||
| Expt B |
2 peptides |
5 spectra |
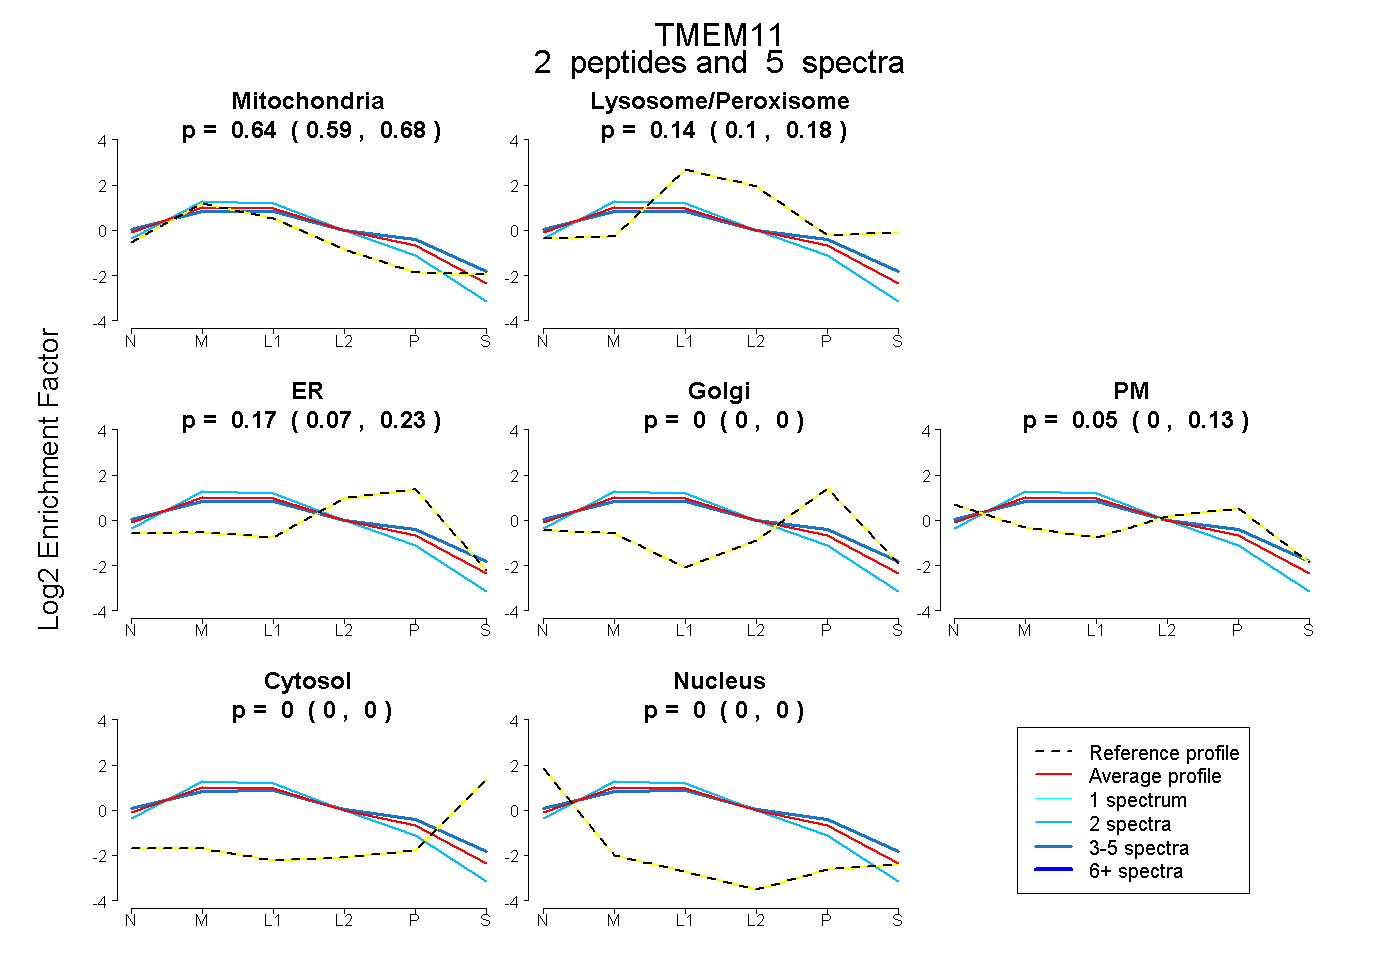 |
0.641 0.591 | 0.683 |
0.140 0.097 | 0.181 |
0.169 0.075 | 0.233 |
0.000 0.000 | 0.000 |
0.050 0.000 | 0.128 |
0.000 0.000 | 0.000 |
0.000 0.000 | 0.000 |
|||
| Plot | Lyso | Other | |||||||||||
| Expt C |
6 peptides |
36 spectra |
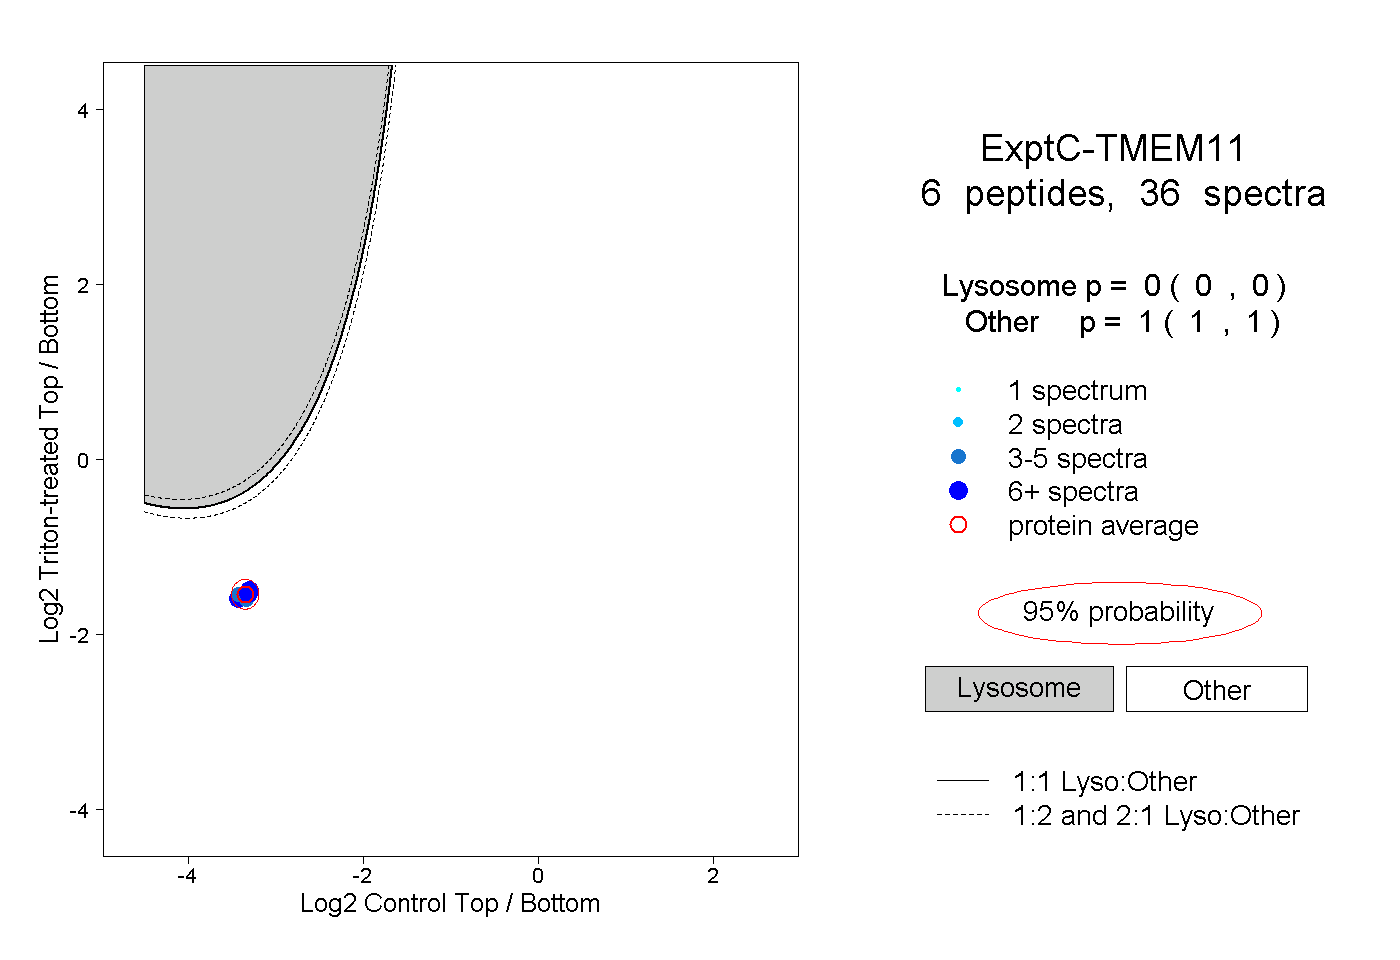 |
0.000 0.000 | 0.000 |
1.000 1.000 | 1.000 |
||||||||
| Plot | Lyso | Other | |||||||||||
| Expt D |
2 peptides |
2 spectra |
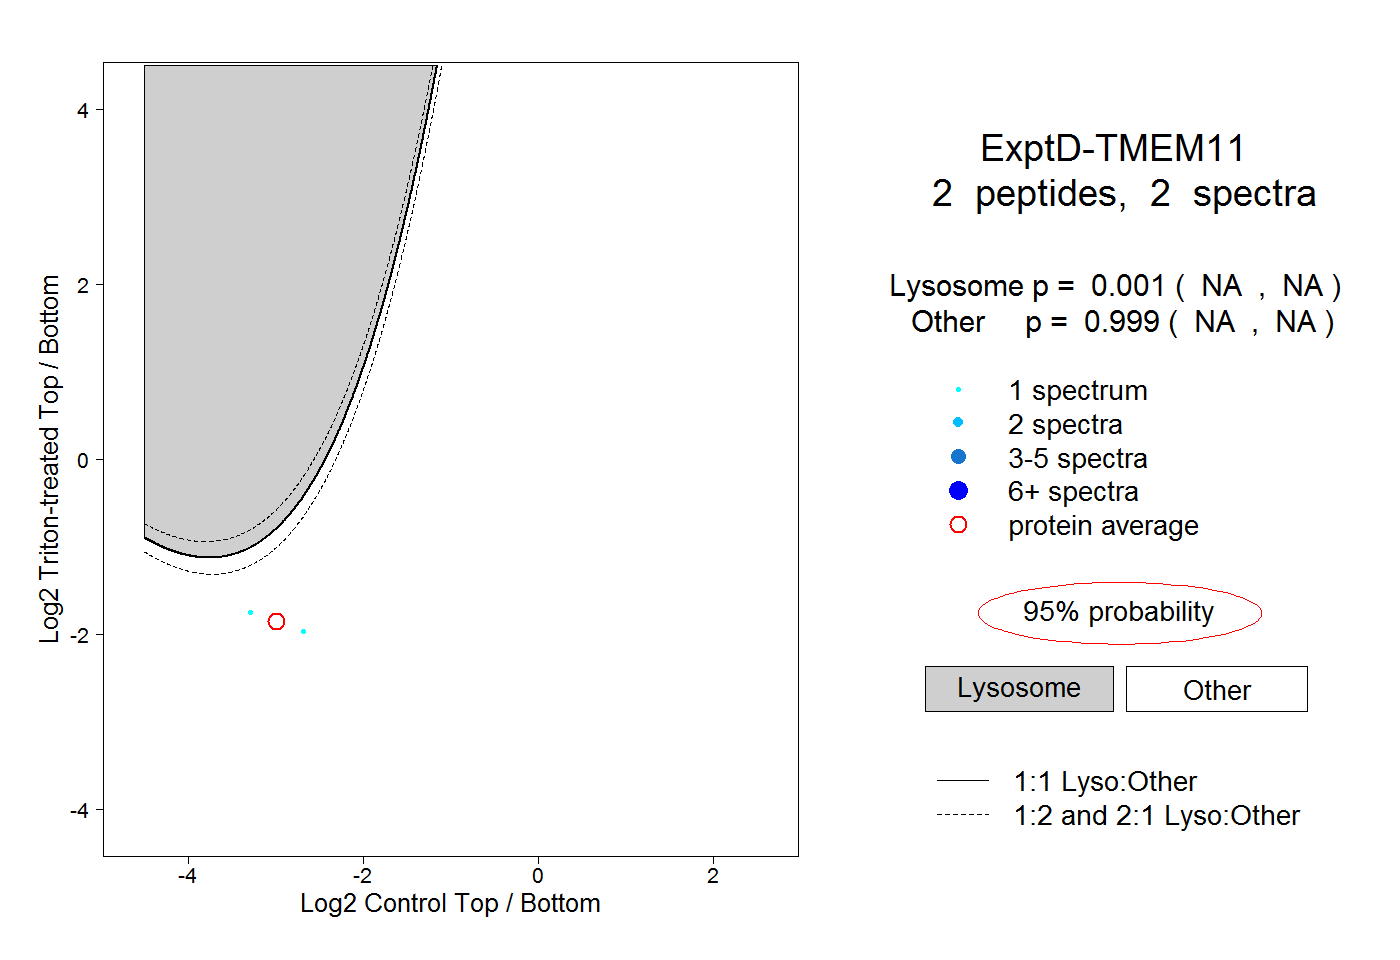 |
0.001 NA | NA |
0.999 NA | NA |