 2
2peptides
spectra
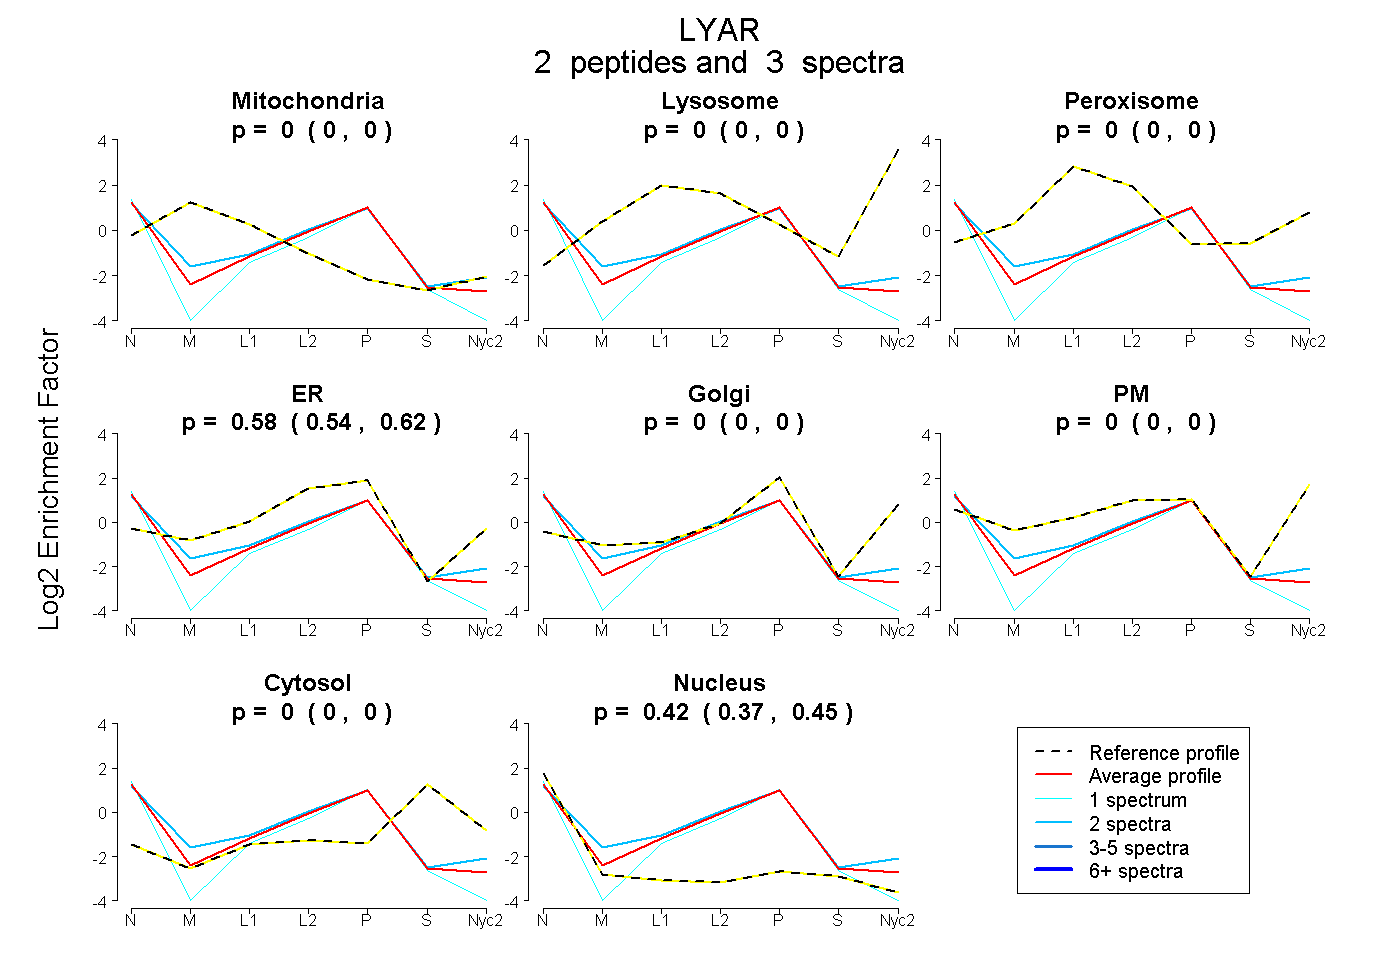
0.000 | 0.000
0.000 | 0.000
0.000 | 0.000
0.539 | 0.620
0.000 | 0.000
0.000 | 0.000
0.000 | 0.000
0.371 | 0.454
| Plot | Mito | Lyso | Perox | ER | Golgi | PM | Cytosol | Nucleus | |||||
| Expt A |
2 peptides |
3 spectra |
|
0.000 0.000 | 0.000 |
0.000 0.000 | 0.000 |
0.000 0.000 | 0.000 |
0.584 0.539 | 0.620 |
0.000 0.000 | 0.000 |
0.000 0.000 | 0.000 |
0.000 0.000 | 0.000 |
0.416 0.371 | 0.454 |
| 1 spectrum, LPGQPEEGEPEDHEAPSK | 0.000 | 0.000 | 0.000 | 0.452 | 0.000 | 0.000 | 0.000 | 0.548 | ||
| 2 spectra, FQNWMR | 0.000 | 0.000 | 0.000 | 0.650 | 0.000 | 0.000 | 0.000 | 0.350 |
| Plot | Lyso | Other | |||||||||||
| Expt C |
1 peptide |
1 spectrum |
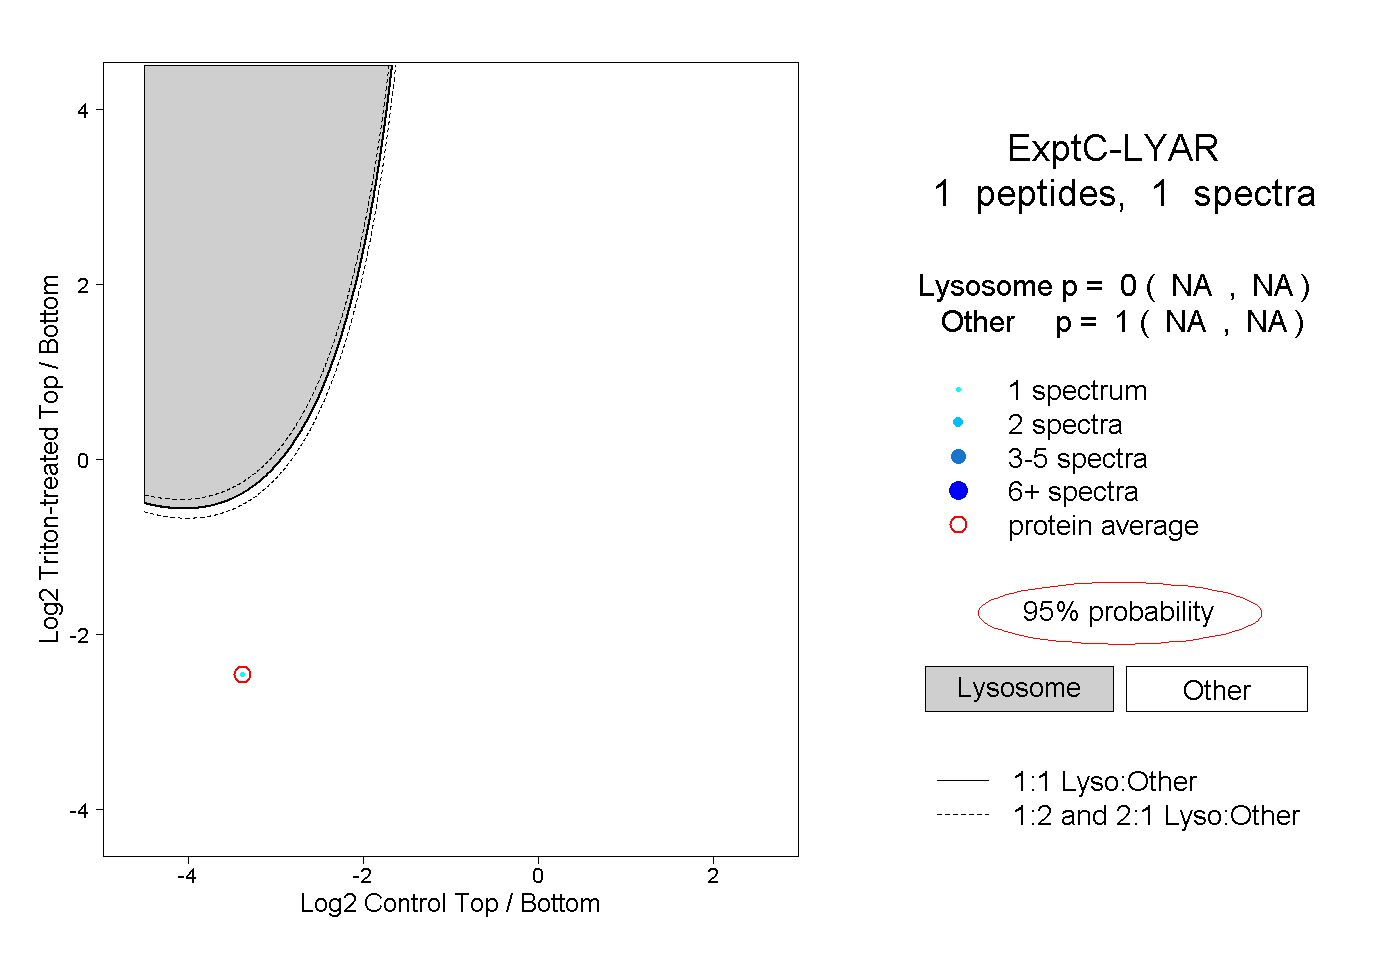 |
0.000 NA | NA |
1.000 NA | NA |