 1
1peptide
spectrum
NA | NA
NA | NA
NA | NA
NA | NA
NA | NA
NA | NA
NA | NA
NA | NA
2peptides
spectra
NA | NA
NA | NA
NA | NA
NA | NA
NA | NA
NA | NA
NA | NA
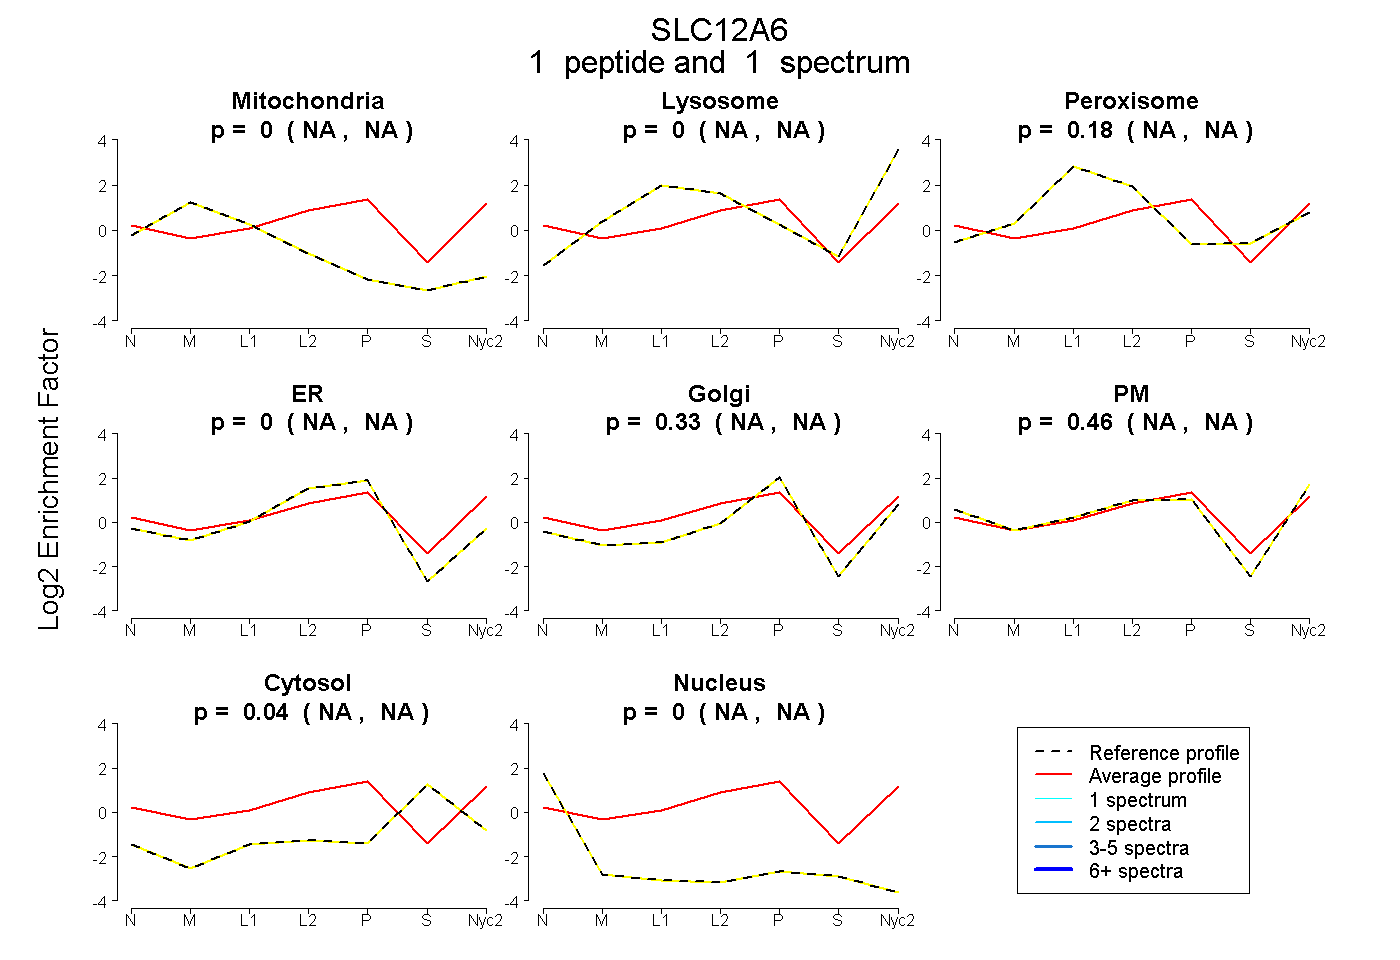
| Plot | Mito | Lyso | Perox | ER | Golgi | PM | Cytosol | Nucleus | |||||
| Expt A |
1 peptide |
1 spectrum |
|
0.000 NA | NA |
0.002 NA | NA |
0.175 NA | NA |
0.000 NA | NA |
0.326 NA | NA |
0.458 NA | NA |
0.039 NA | NA |
0.000 NA | NA |
||
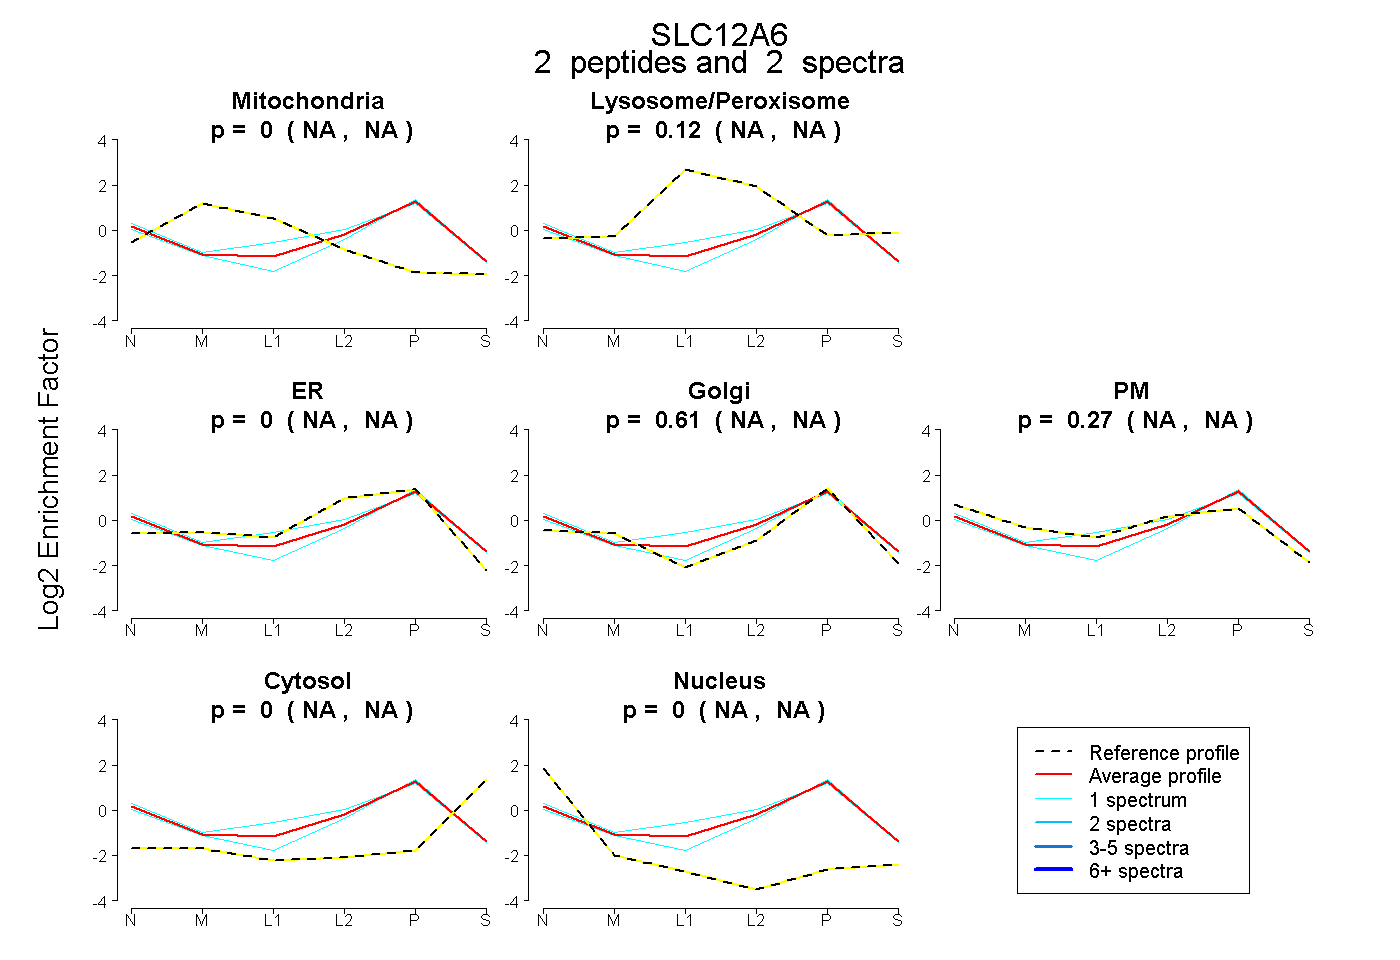
| Plot | Mito | Lyso or Perox | ER | Golgi | PM | Cytosol | Nucleus | ||||||
| Expt B |
2 peptides |
2 spectra |
|
0.000 NA | NA |
0.123 NA | NA |
0.000 NA | NA |
0.606 NA | NA |
0.267 NA | NA |
0.004 NA | NA |
0.000 NA | NA |
| 1 spectrum, GLSLSAAR | 0.000 | 0.000 | 0.091 | 0.628 | 0.219 | 0.063 | 0.000 | |||
| 1 spectrum, DNIIPFLR | 0.000 | 0.192 | 0.013 | 0.435 | 0.360 | 0.000 | 0.000 |