 15
15peptides
spectra
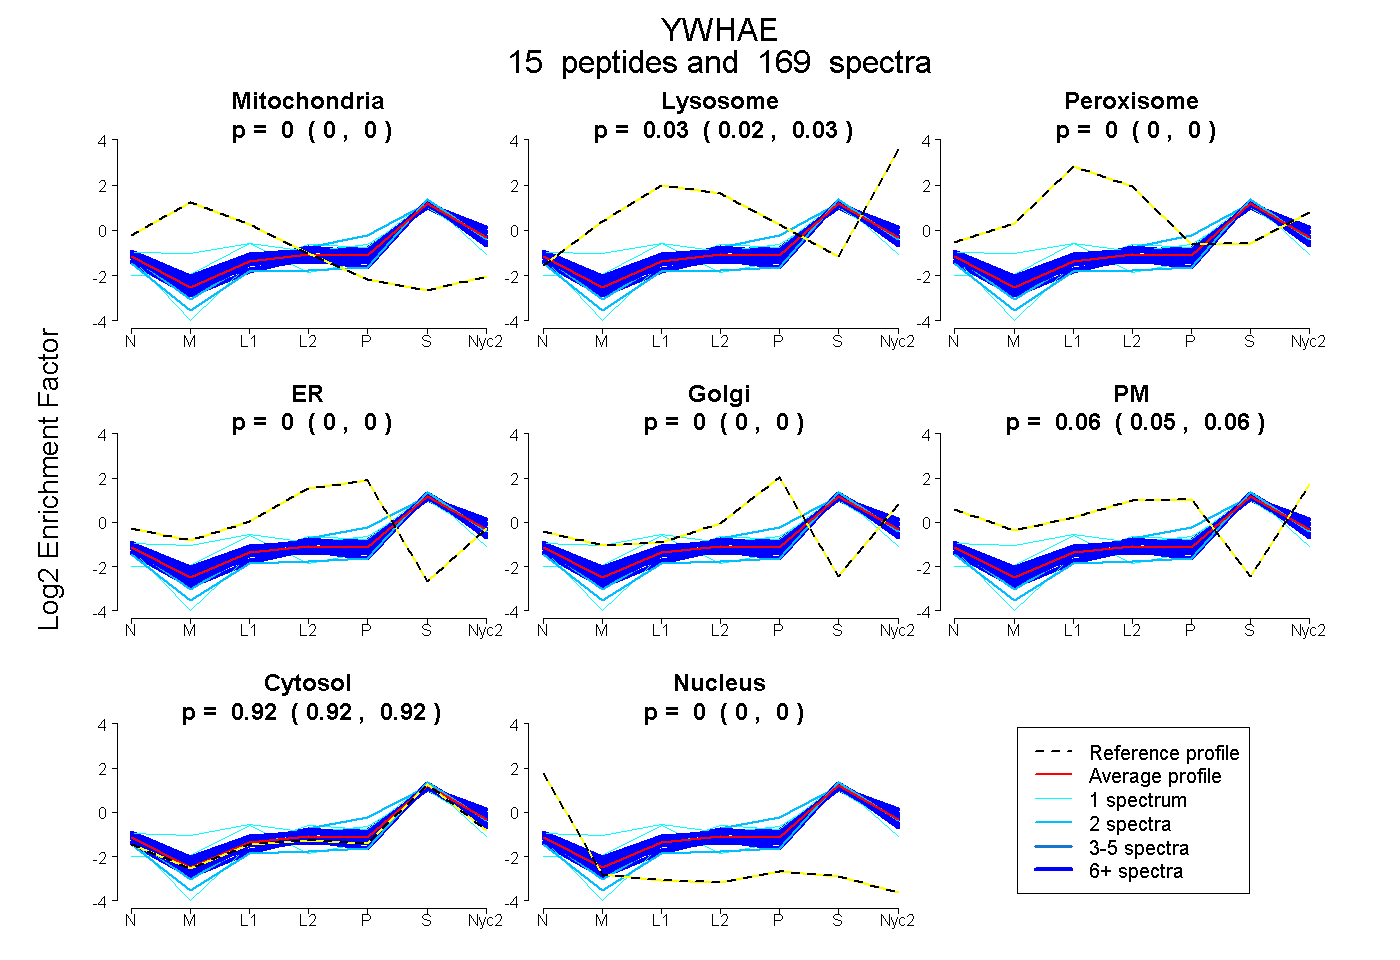
0.000 | 0.000
0.023 | 0.027
0.000 | 0.000
0.000 | 0.000
0.000 | 0.000
0.054 | 0.058
0.917 | 0.920
0.000 | 0.000
6peptides
spectra
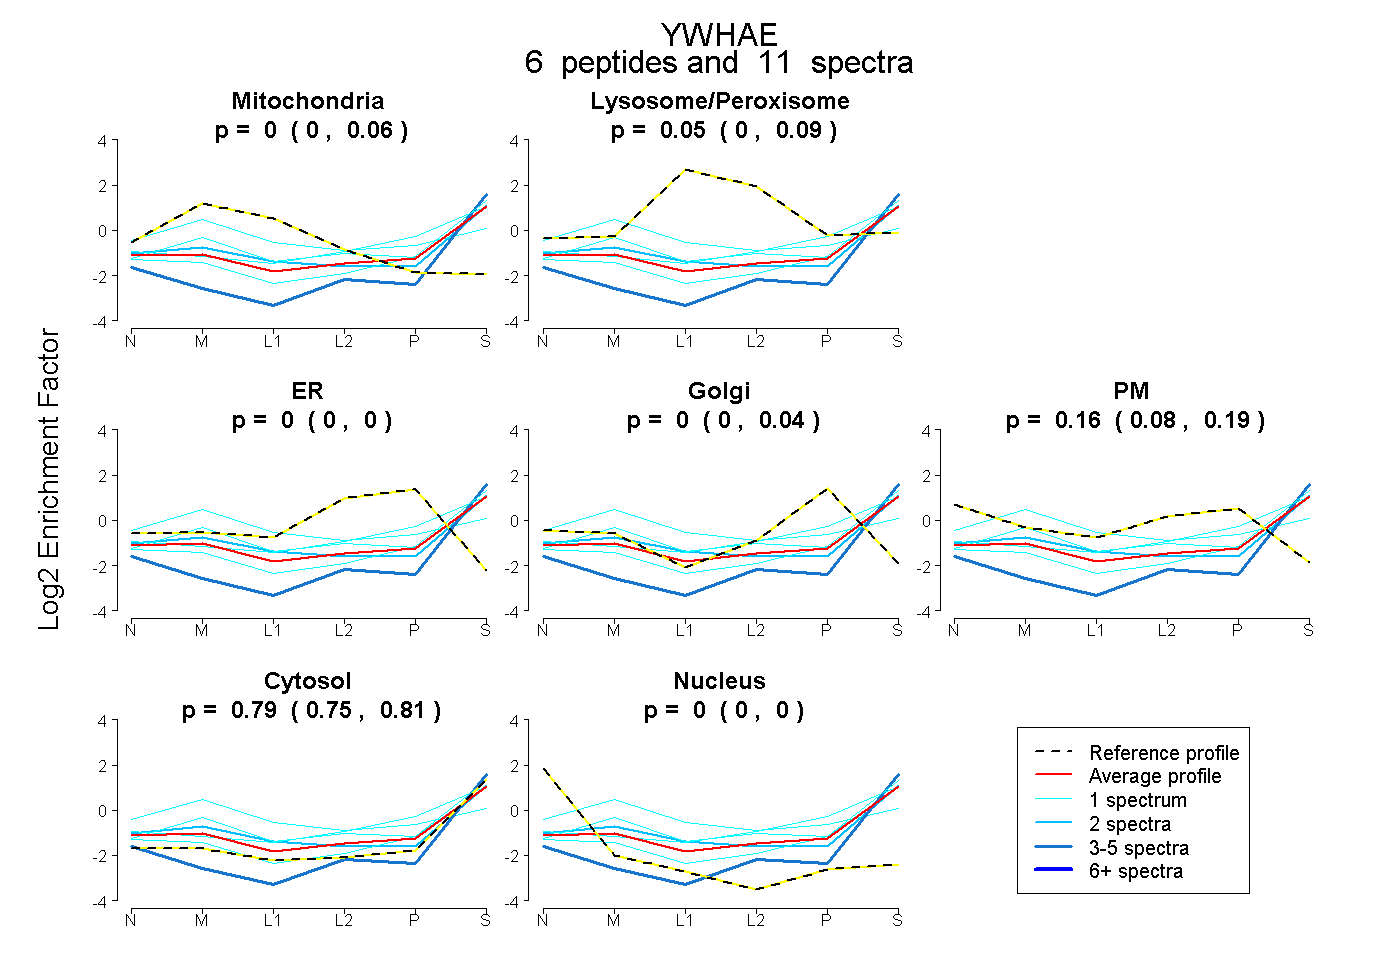
0.000 | 0.061
0.004 | 0.094
0.000 | 0.000
0.000 | 0.040
0.076 | 0.189
0.745 | 0.809
0.000 | 0.000
13peptides
spectra
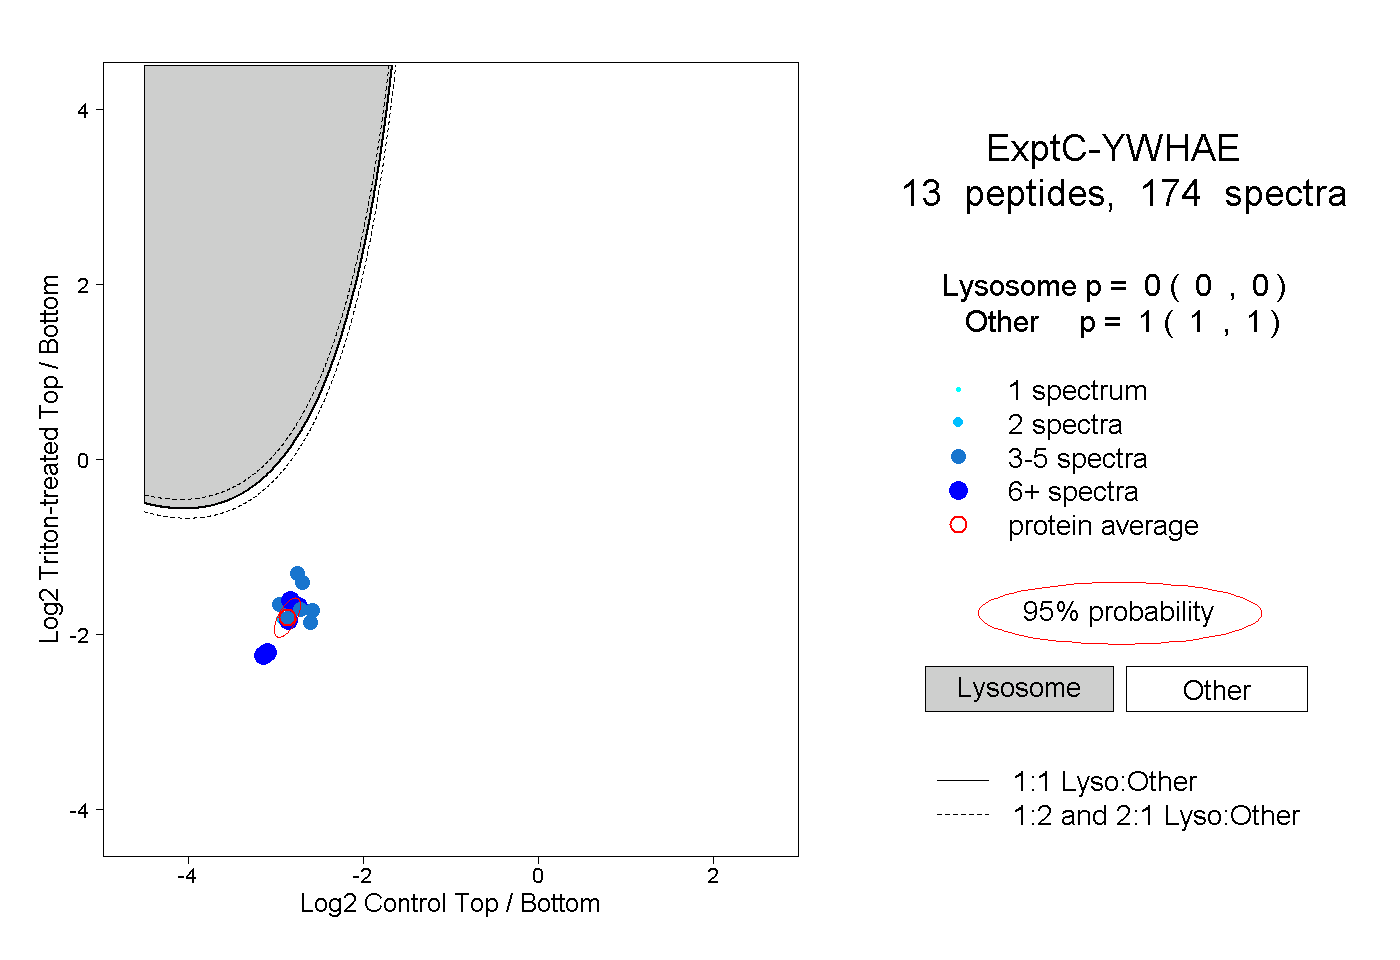
0.000 | 0.000
1.000 | 1.000
5peptides
spectra
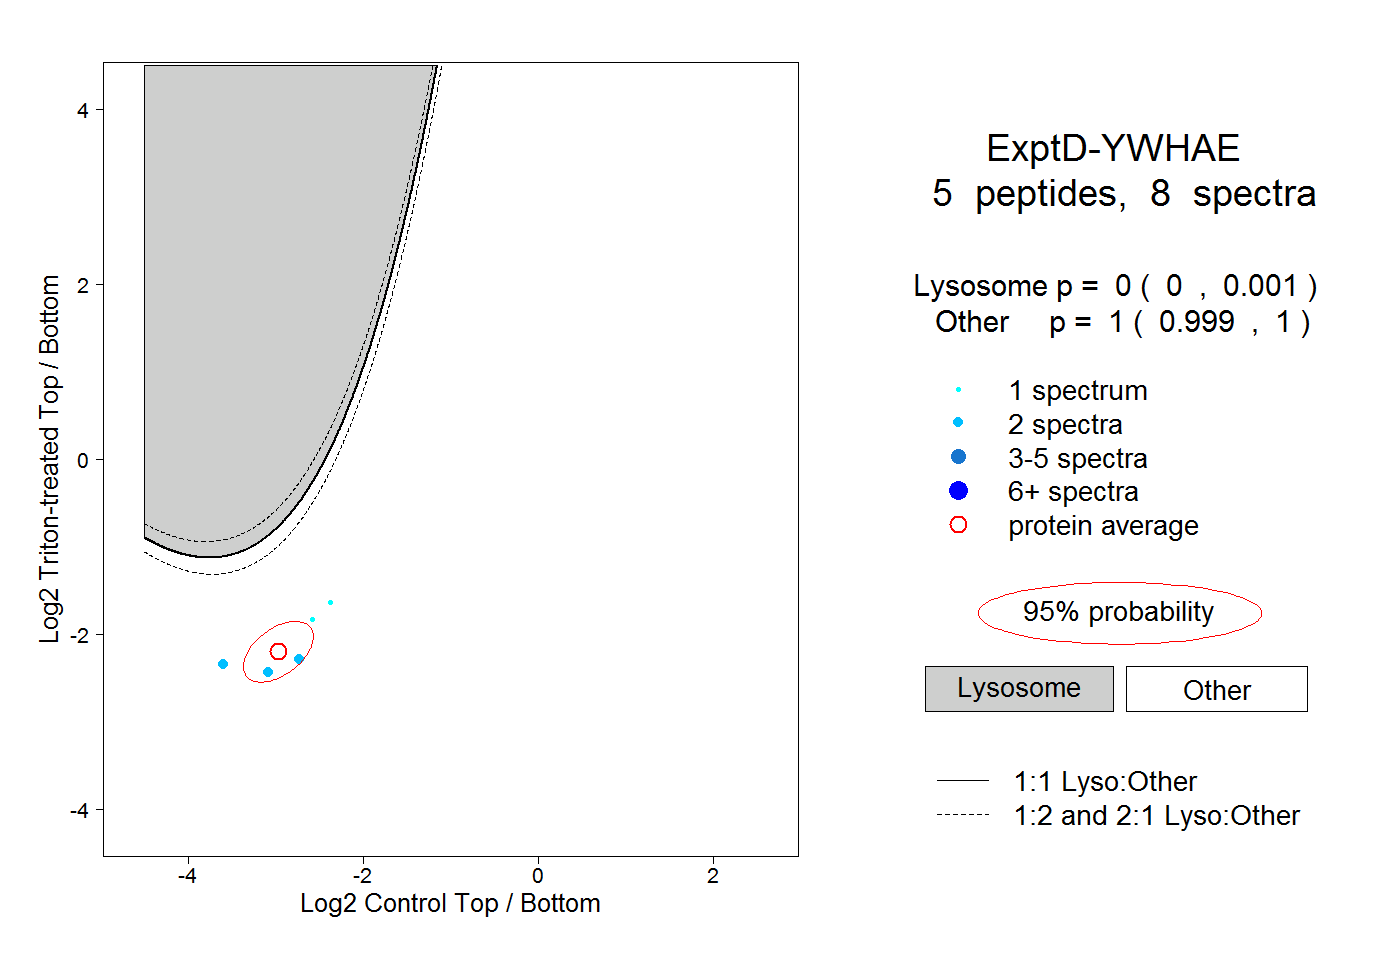
0.000 | 0.001
0.999 | 1.000