SHMT1
[ENSRNOP00000007092]
Main page
| | | Plot |
Mito |
Lyso |
|
Perox |
ER |
Golgi |
PM |
Cytosol |
Nucleus |
|
| Expt A |
 23
23
peptides |
215
spectra |
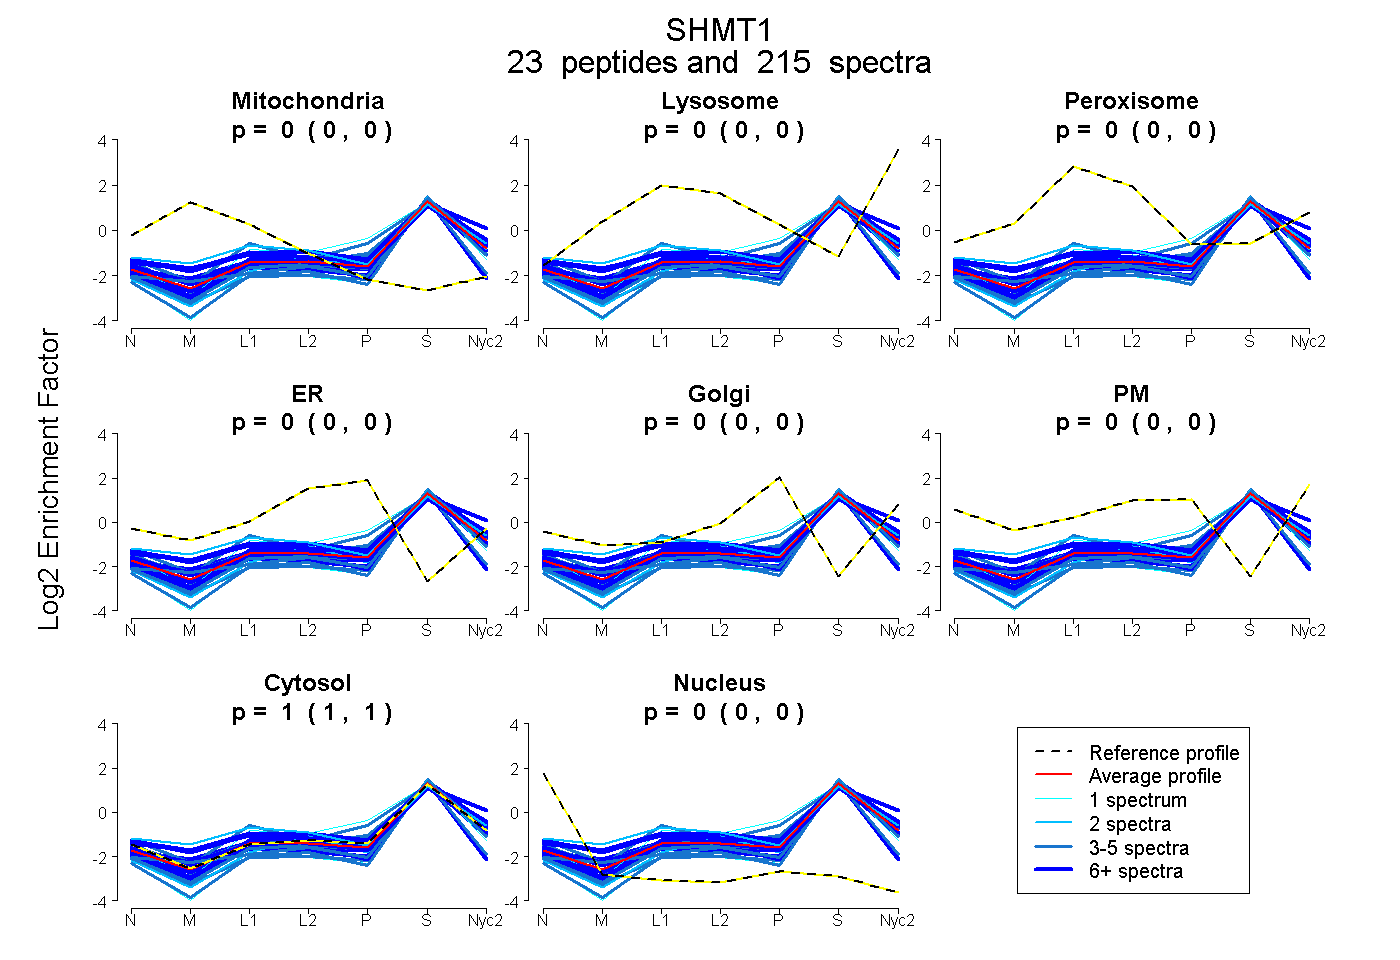 |
0.000
0.000 | 0.000 |
0.000
0.000 | 0.000 |
|
0.000
0.000 | 0.000 |
0.000
0.000 | 0.000 |
0.000
0.000 | 0.000 |
0.000
0.000 | 0.000 |
1.000
1.000 | 1.000 |
0.000
0.000 | 0.000 |
|
| | | Plot |
Mito |
|
Lyso or Perox |
|
ER |
Golgi |
PM |
Cytosol |
Nucleus |
|
| Expt B |
15
peptides |
82
spectra |
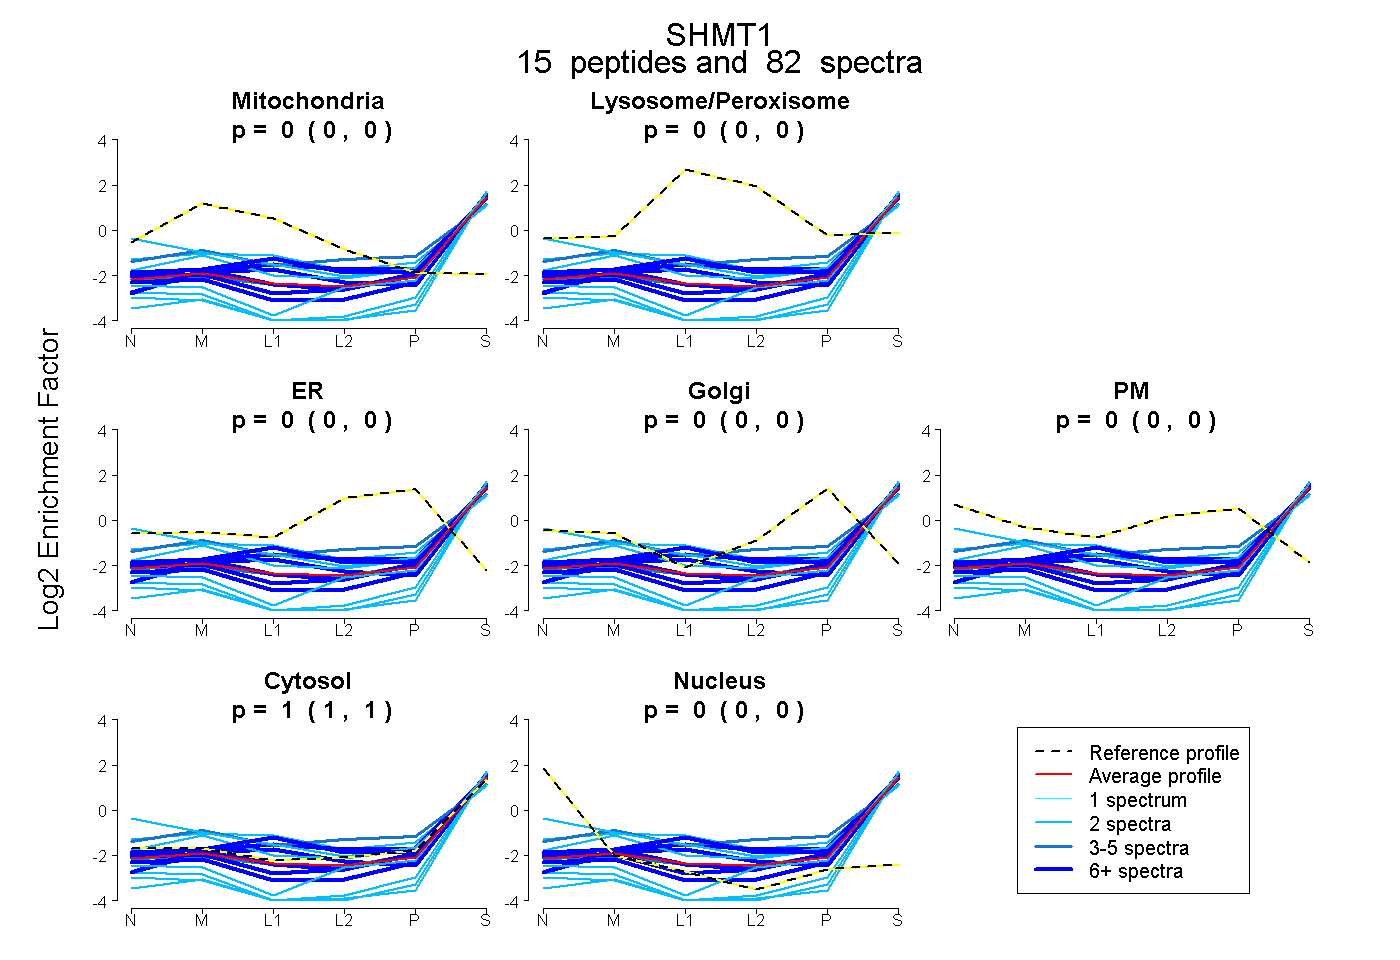 |
0.000
0.000 | 0.000 |
|
0.000
0.000 | 0.000 |
|
0.000
0.000 | 0.000 |
0.000
0.000 | 0.000 |
0.000
0.000 | 0.000 |
1.000
1.000 | 1.000 |
0.000
0.000 | 0.000 |
|
| | | Plot |
|
Lyso |
|
|
|
|
|
|
|
Other |
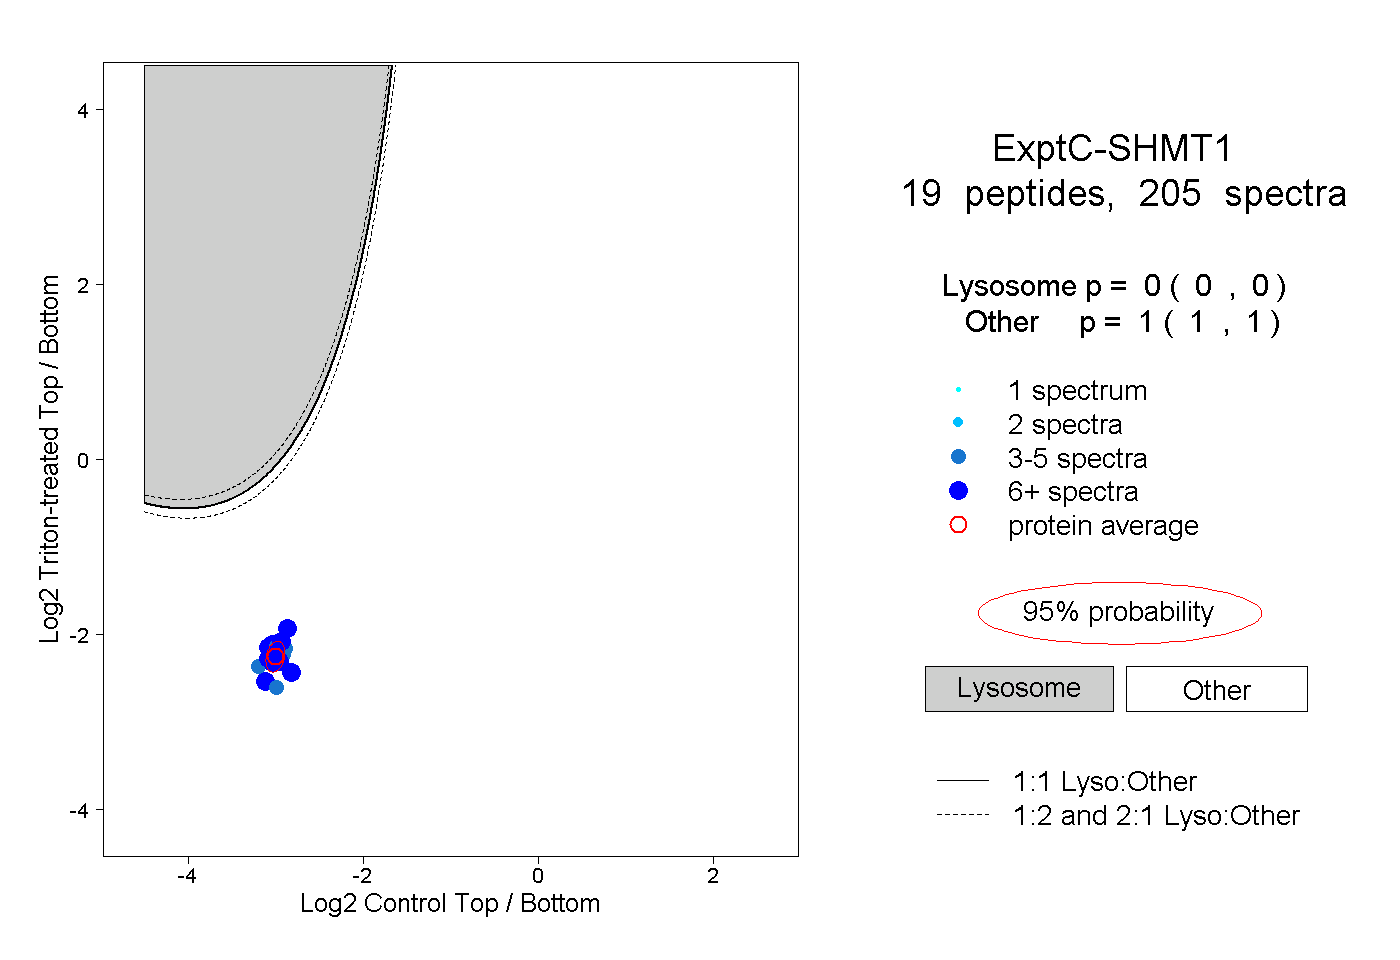
| Expt C |
19
peptides |
205
spectra |
 |
|
0.000
0.000 | 0.000 |
|
|
|
|
|
|
|
1.000
1.000 | 1.000 |
| 14 spectra, SALRPSGLR |
|
0.000 |
|
|
|
|
|
|
|
1.000 |
| 18 spectra, YSEGYPGQR |
|
0.000 |
|
|
|
|
|
|
|
1.000 |
| 6 spectra, IYQLQVLANCR |
|
0.000 |
|
|
|
|
|
|
|
1.000 |
| 11 spectra, QAMTTEFK |
|
0.000 |
|
|
|
|
|
|
|
1.000 |
| 1 spectrum, ALSDALTELGYK |
|
0.000 |
|
|
|
|
|
|
|
1.000 |
| 26 spectra, MLTQPLK |
|
0.000 |
|
|
|
|
|
|
|
1.000 |
| 10 spectra, LGTPALTSR |
|
0.000 |
|
|
|
|
|
|
|
1.000 |
| 10 spectra, NTCPGDK |
|
0.000 |
|
|
|
|
|
|
|
1.000 |
| 3 spectra, ESDAEVYSIIK |
|
0.000 |
|
|
|
|
|
|
|
1.000 |
| 4 spectra, VLEACSIACNK |
|
0.000 |
|
|
|
|
|
|
|
1.000 |
| 20 spectra, LIIAGTSCYSR |
|
0.000 |
|
|
|
|
|
|
|
1.000 |
| 4 spectra, NLDYAR |
|
0.000 |
|
|
|
|
|
|
|
1.000 |
| 18 spectra, DATVWASHEK |
|
0.000 |
|
|
|
|
|
|
|
1.000 |
| 15 spectra, LTGDEK |
|
0.000 |
|
|
|
|
|
|
|
1.000 |
| 12 spectra, GLLEEDFQK |
|
0.000 |
|
|
|
|
|
|
|
1.000 |
| 15 spectra, AGMIFYR |
|
0.000 |
|
|
|
|
|
|
|
1.000 |
| 9 spectra, FQSAVAALR |
|
0.000 |
|
|
|
|
|
|
|
1.000 |
| 5 spectra, AVLEALGSCLNNK |
|
0.000 |
|
|
|
|
|
|
|
1.000 |
| 4 spectra, IAHFIHR |
|
0.000 |
|
|
|
|
|
|
|
1.000 |
| | | Plot |
|
Lyso |
|
|
|
|
|
|
|
Other |
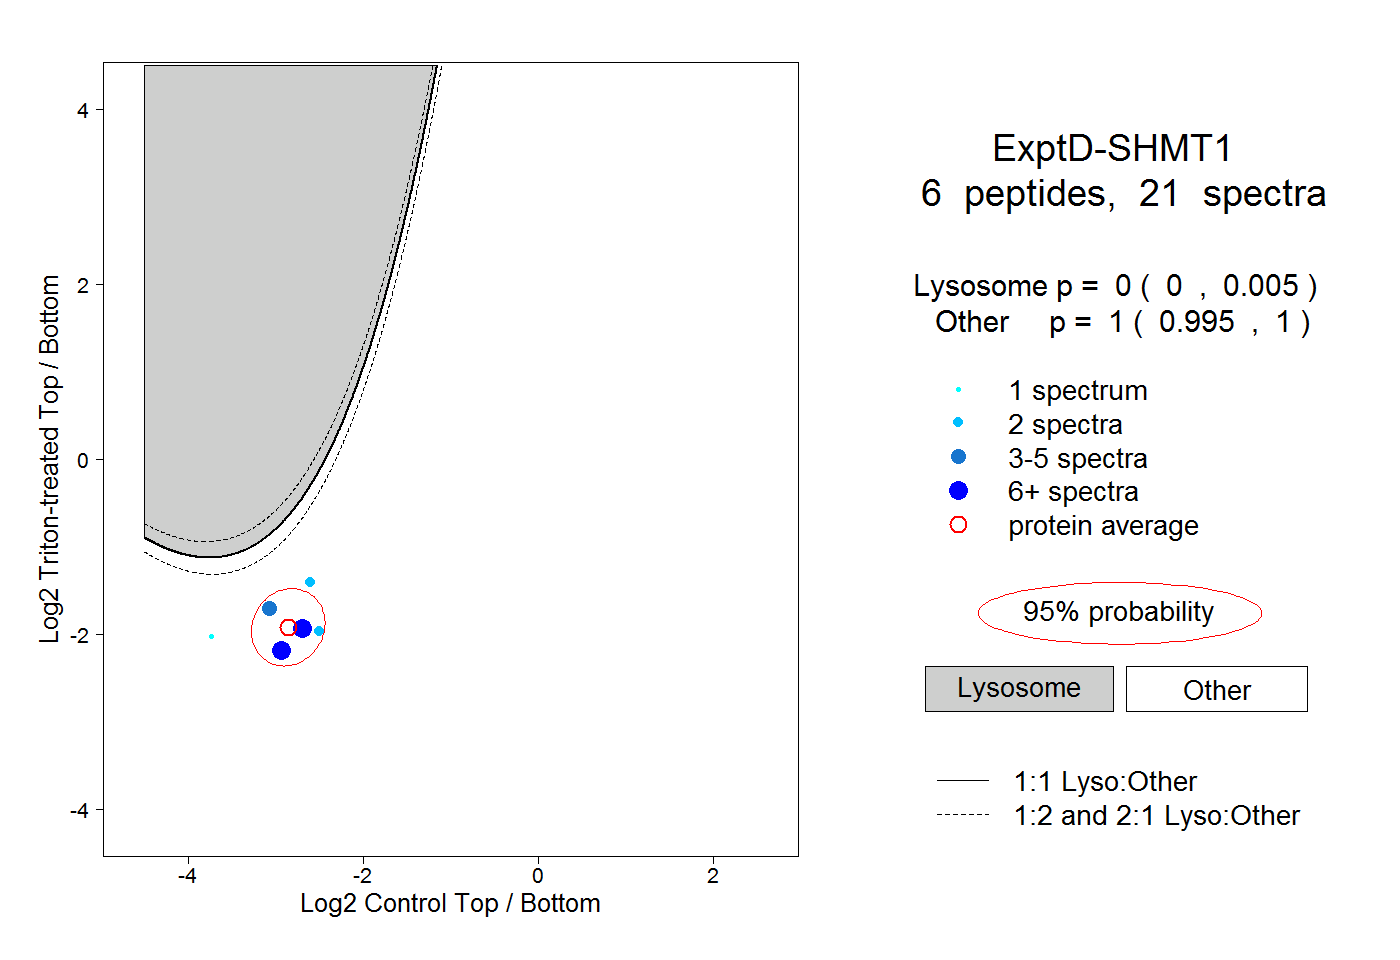
| Expt D |
6
peptides |
21
spectra |
 |
|
0.000
0.000 | 0.005 |
|
|
|
|
|
|
|
1.000
0.995 | 1.000 |