13
13peptides
spectra
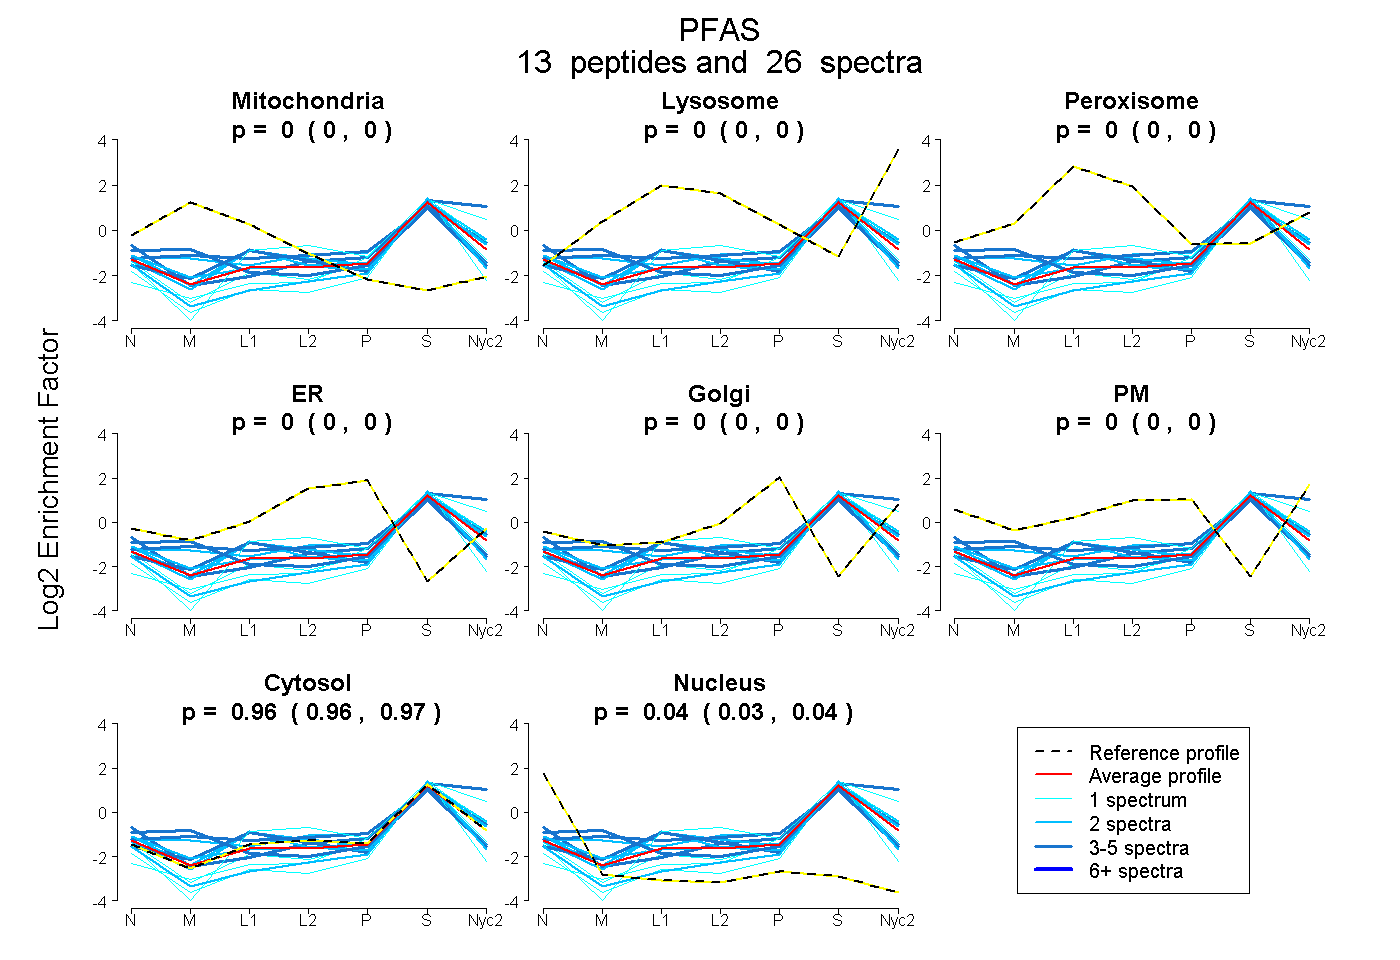
0.000 | 0.003
0.000 | 0.000
0.000 | 0.000
0.000 | 0.000
0.000 | 0.000
0.000 | 0.000
0.955 | 0.970
0.027 | 0.043
5peptides
spectra
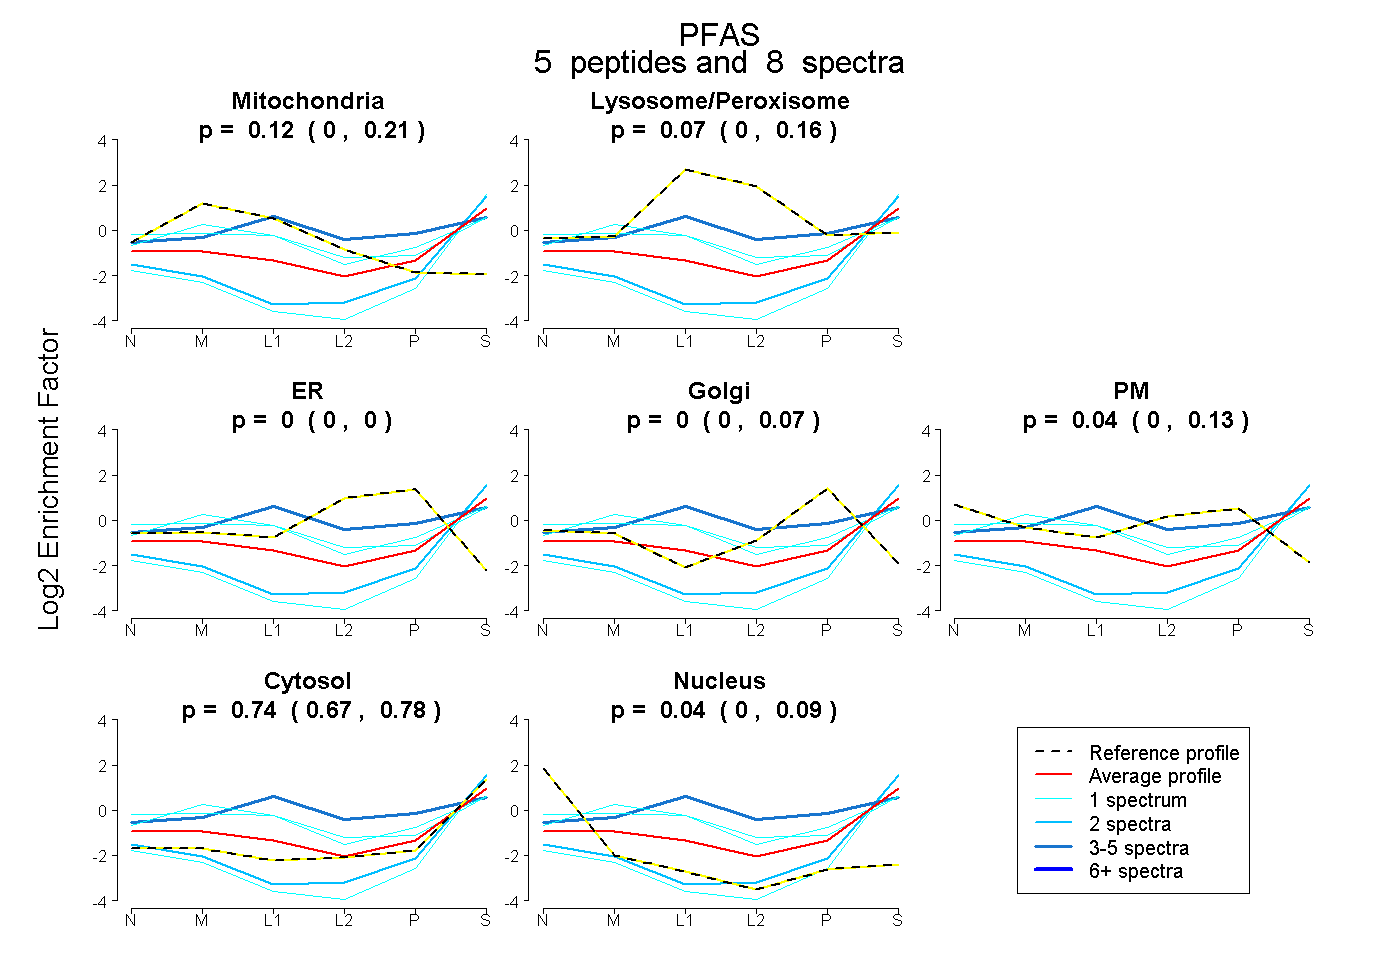
0.003 | 0.207
0.000 | 0.161
0.000 | 0.000
0.000 | 0.067
0.000 | 0.135
0.670 | 0.783
0.000 | 0.092