 13
13peptides
spectra
0.000 | 0.003
0.000 | 0.000
0.000 | 0.000
0.000 | 0.000
0.000 | 0.000
0.000 | 0.000
0.955 | 0.970
0.027 | 0.043
| Plot | Mito | Lyso | Perox | ER | Golgi | PM | Cytosol | Nucleus | |||||
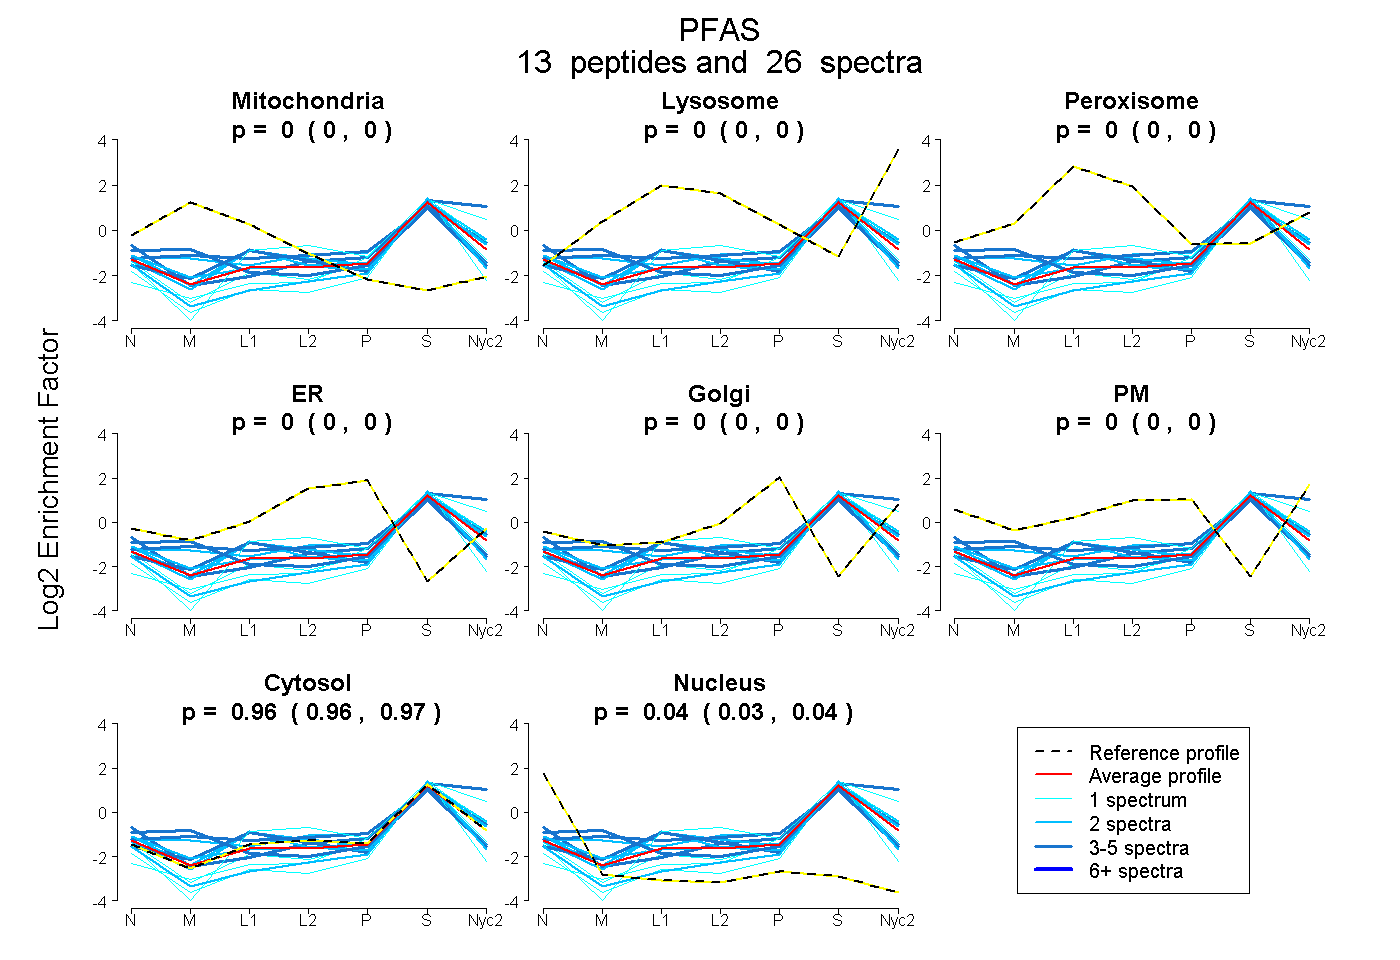
| Expt A |
13 peptides |
26 spectra |
|
0.000 0.000 | 0.003 |
0.000 0.000 | 0.000 |
0.000 0.000 | 0.000 |
0.000 0.000 | 0.000 |
0.000 0.000 | 0.000 |
0.000 0.000 | 0.000 |
0.964 0.955 | 0.970 |
0.036 0.027 | 0.043 |
| 2 spectra, FLRPEDSTRPSCFR | 0.092 | 0.044 | 0.000 | 0.000 | 0.053 | 0.000 | 0.811 | 0.000 | ||
| 3 spectra, DSLSMAAR | 0.000 | 0.000 | 0.000 | 0.000 | 0.000 | 0.000 | 0.870 | 0.130 | ||
| 3 spectra, VEPGPALMLR | 0.190 | 0.000 | 0.000 | 0.000 | 0.000 | 0.000 | 0.743 | 0.067 | ||
| 1 spectrum, DSINILAEGRPALEK | 0.000 | 0.000 | 0.000 | 0.000 | 0.000 | 0.000 | 0.913 | 0.087 | ||
| 2 spectra, VGGPVYR | 0.000 | 0.000 | 0.000 | 0.000 | 0.000 | 0.000 | 0.857 | 0.143 | ||
| 1 spectrum, FCDNSSAIQGK | 0.000 | 0.000 | 0.000 | 0.000 | 0.000 | 0.000 | 0.823 | 0.177 | ||
| 2 spectra, DVQCTGR | 0.012 | 0.000 | 0.026 | 0.000 | 0.000 | 0.000 | 0.933 | 0.029 | ||
| 1 spectrum, QPTAEMEAISLAALHDR | 0.000 | 0.092 | 0.000 | 0.000 | 0.000 | 0.000 | 0.908 | 0.000 | ||
| 1 spectrum, LPAVASK | 0.000 | 0.000 | 0.000 | 0.000 | 0.000 | 0.000 | 1.000 | 0.000 | ||
| 3 spectra, HLALMPHPER | 0.109 | 0.086 | 0.000 | 0.000 | 0.020 | 0.000 | 0.786 | 0.000 | ||
| 2 spectra, SLGLQLPDGQR | 0.035 | 0.000 | 0.000 | 0.000 | 0.000 | 0.000 | 0.940 | 0.025 | ||
| 3 spectra, GQLHVDGK | 0.000 | 0.183 | 0.000 | 0.000 | 0.000 | 0.000 | 0.817 | 0.000 | ||
| 2 spectra, EFFLQR | 0.000 | 0.039 | 0.027 | 0.000 | 0.000 | 0.000 | 0.928 | 0.005 |
| Plot | Mito | Lyso or Perox | ER | Golgi | PM | Cytosol | Nucleus | ||||||
| Expt B |
5 peptides |
8 spectra |
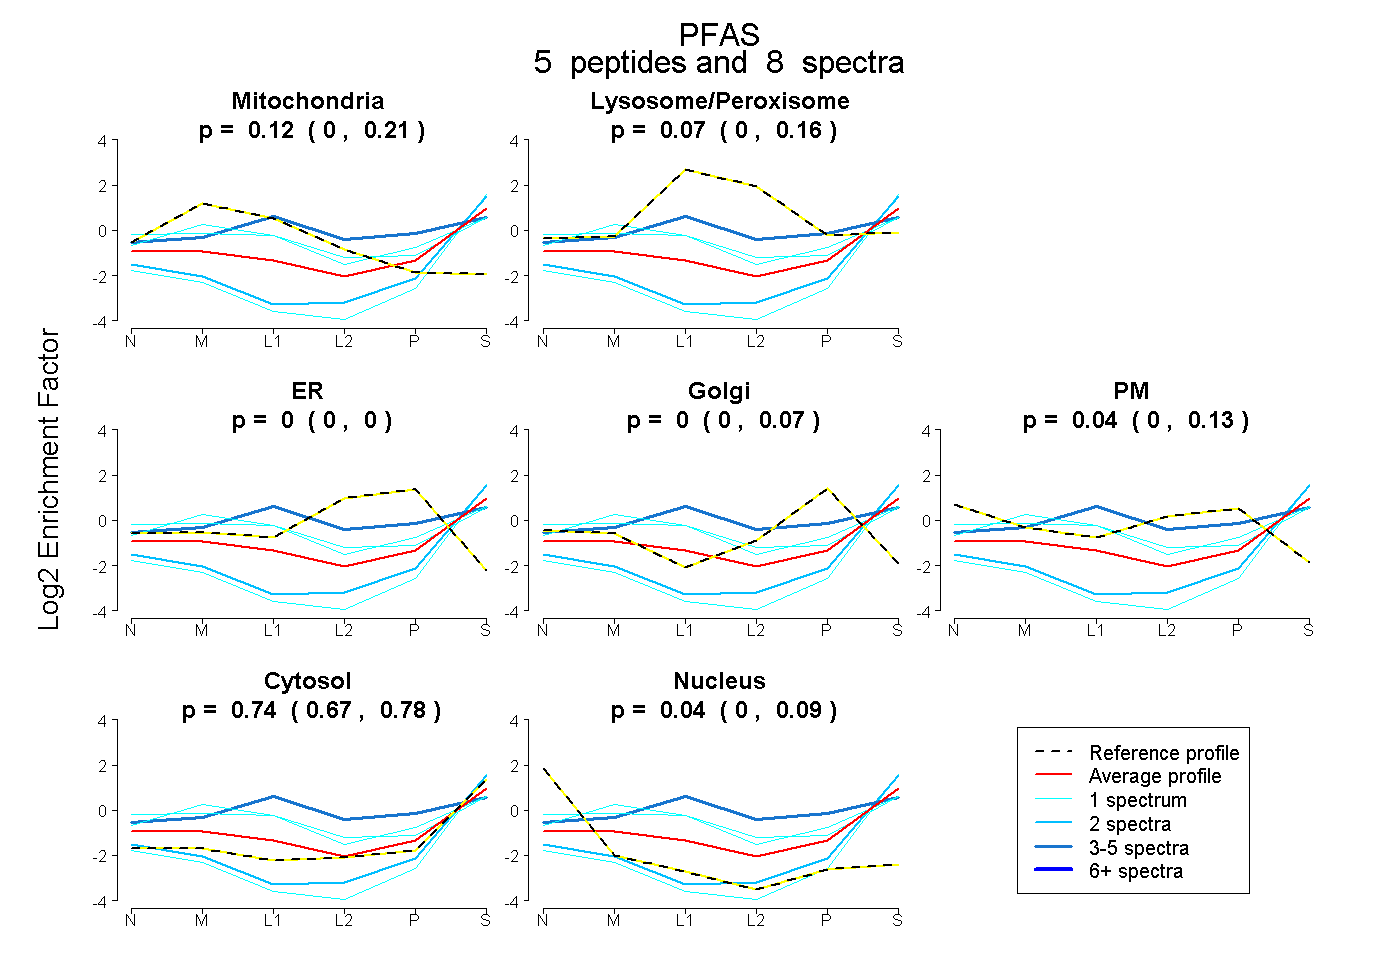 |
0.120 0.003 | 0.207 |
0.066 0.000 | 0.161 |
0.000 0.000 | 0.000 |
0.000 0.000 | 0.067 |
0.037 0.000 | 0.135 |
0.741 0.670 | 0.783 |
0.036 0.000 | 0.092 |
|||
| Plot | Lyso | Other | |||||||||||
| Expt C |
5 peptides |
7 spectra |
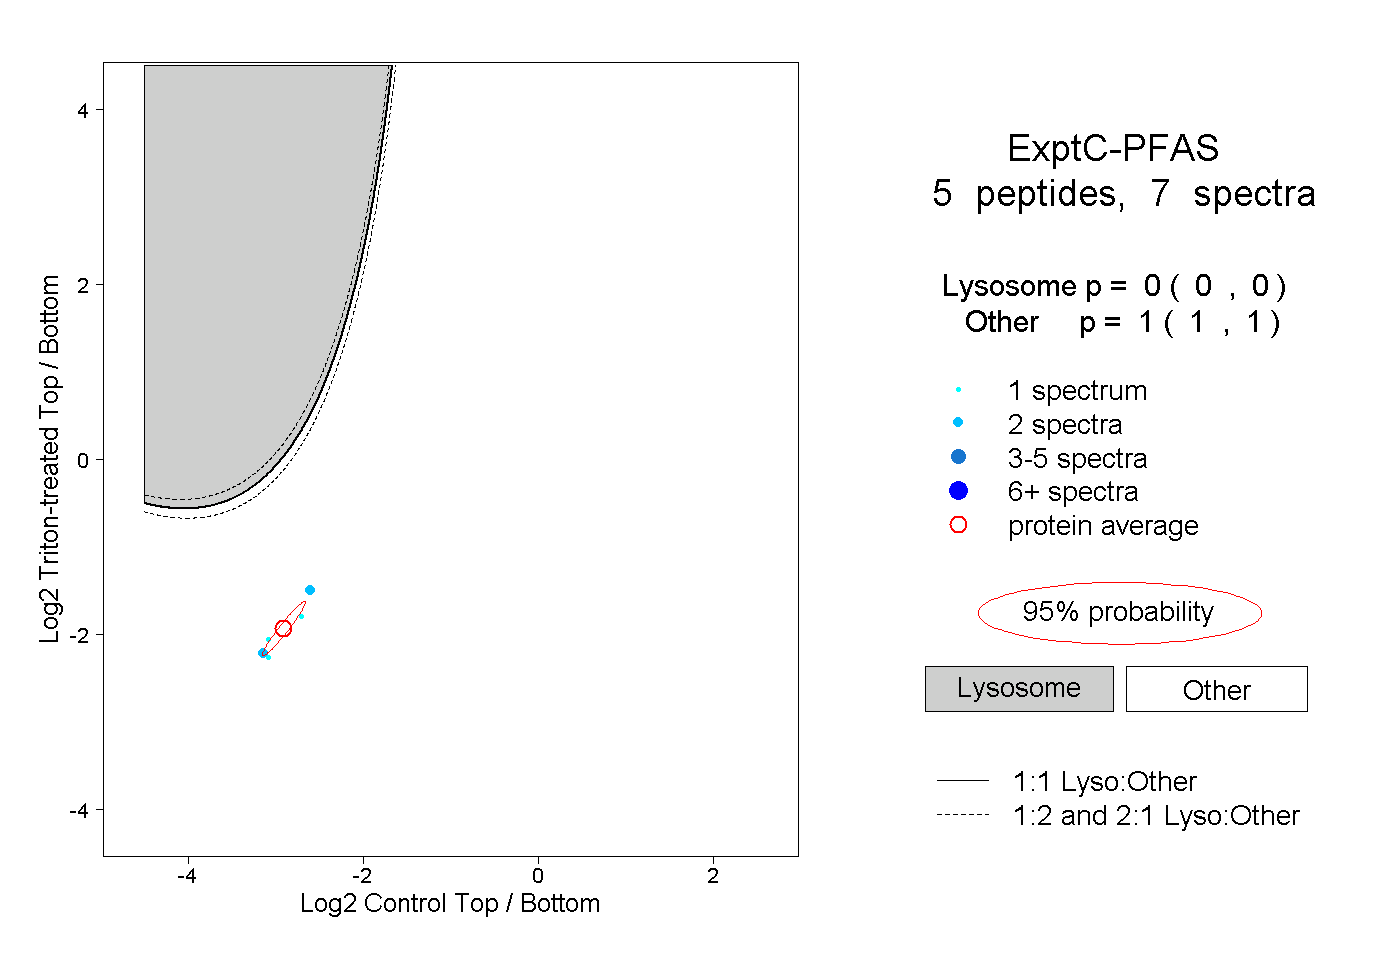 |
0.000 0.000 | 0.000 |
1.000 1.000 | 1.000 |