 2
2peptides
spectra
NA | NA
NA | NA
NA | NA
NA | NA
NA | NA
NA | NA
NA | NA
NA | NA
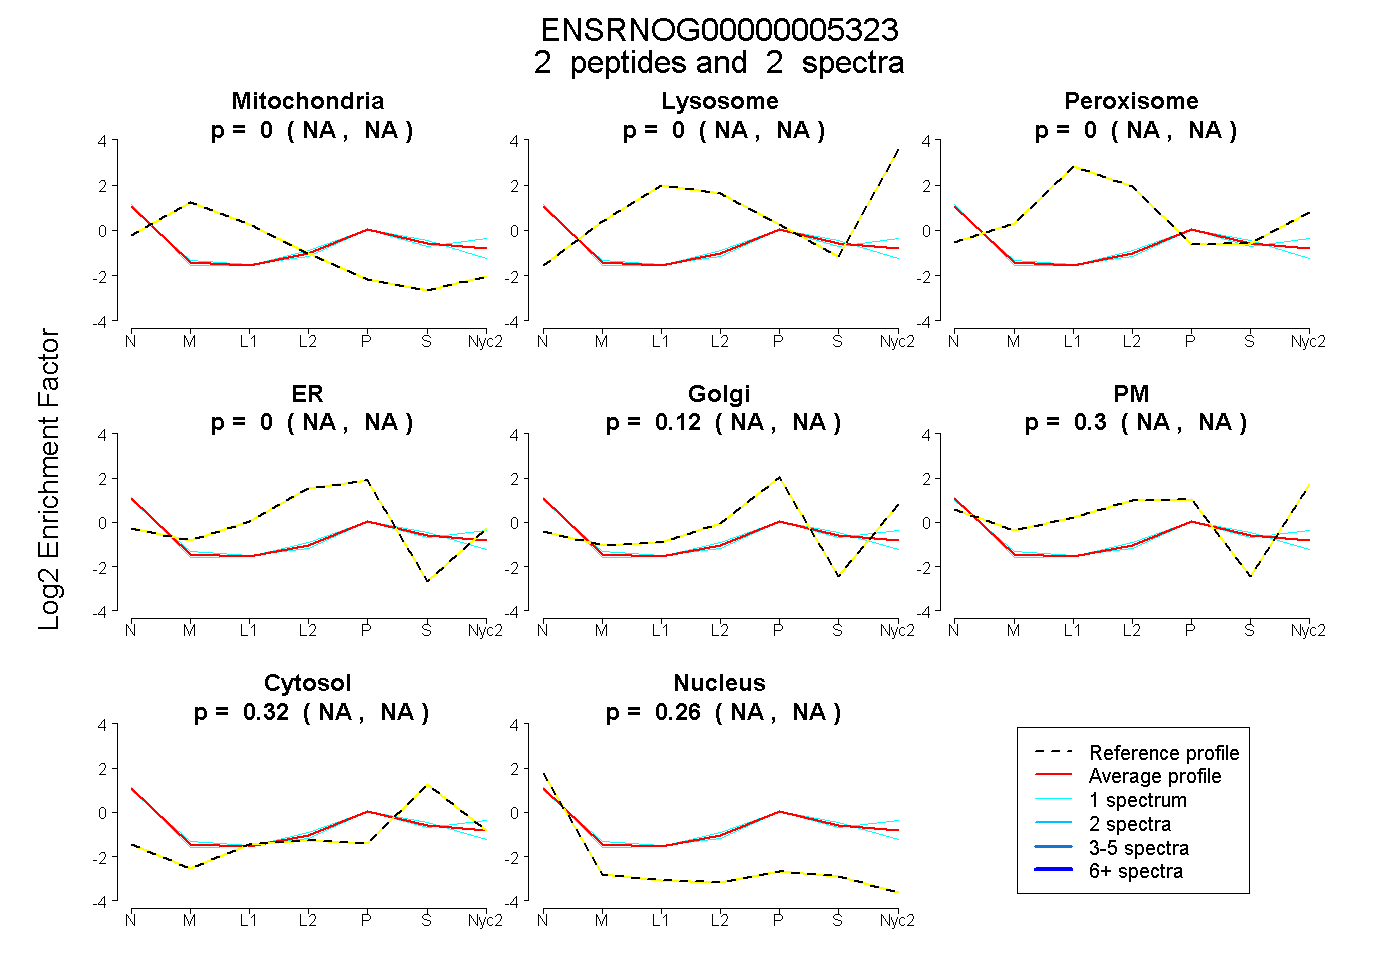
| Plot | Mito | Lyso | Perox | ER | Golgi | PM | Cytosol | Nucleus | |||||
| Expt A |
2 peptides |
2 spectra |
|
0.000 NA | NA |
0.000 NA | NA |
0.000 NA | NA |
0.000 NA | NA |
0.125 NA | NA |
0.299 NA | NA |
0.318 NA | NA |
0.259 NA | NA |
| 1 spectrum, LNEFEIVLAQFK | 0.000 | 0.000 | 0.000 | 0.000 | 0.089 | 0.367 | 0.302 | 0.242 | ||
| 1 spectrum, EEFEGTR | 0.000 | 0.000 | 0.000 | 0.064 | 0.119 | 0.205 | 0.336 | 0.276 |
| Plot | Mito | Lyso or Perox | ER | Golgi | PM | Cytosol | Nucleus | ||||||
| Expt B |
2 peptides |
2 spectra |
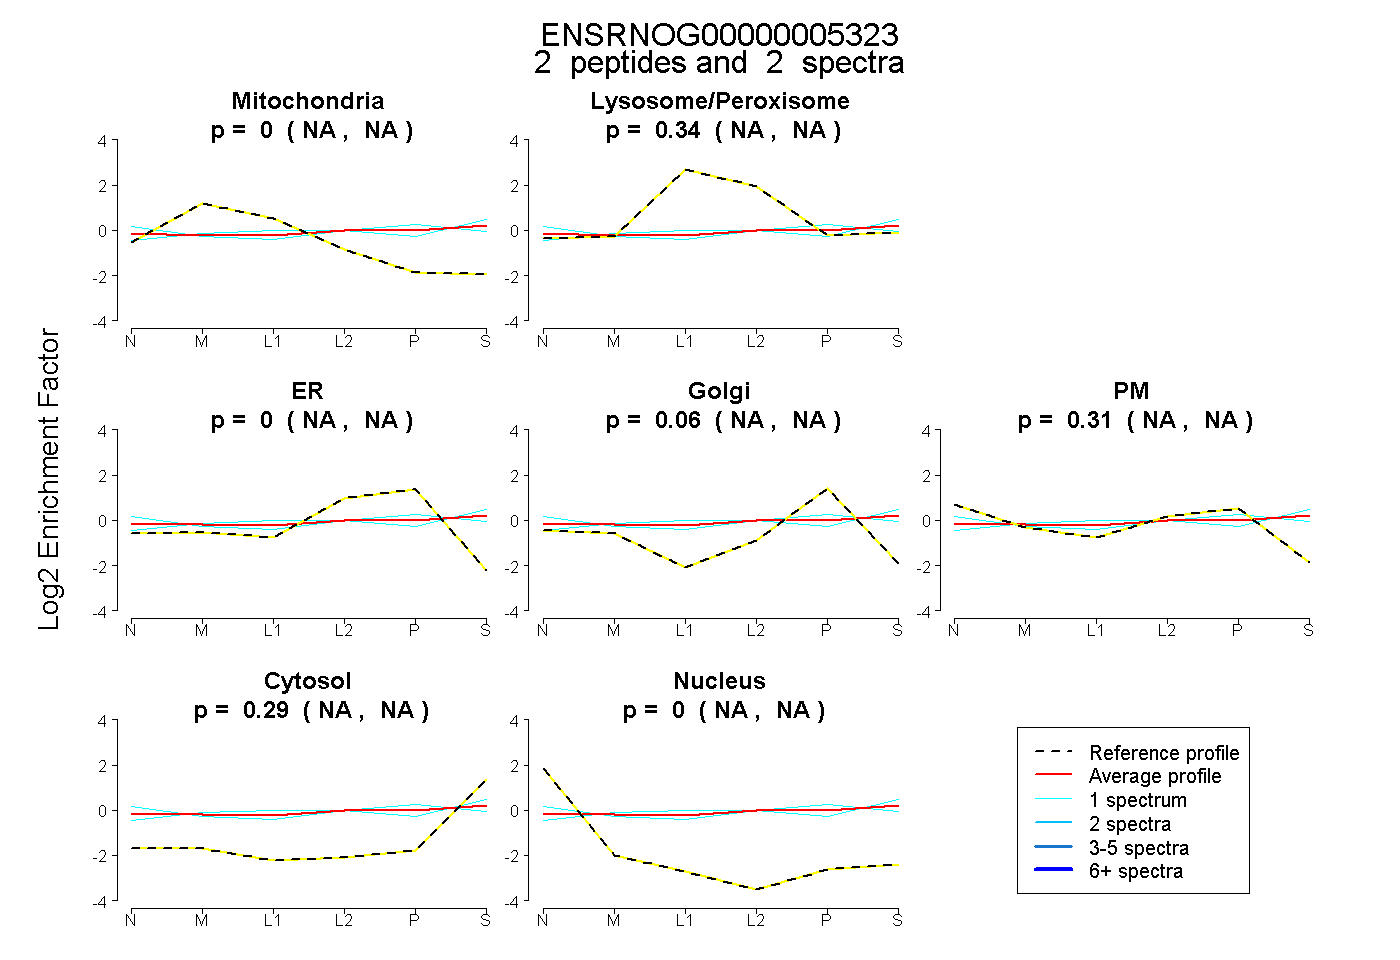 |
0.000 NA | NA |
0.337 NA | NA |
0.000 NA | NA |
0.062 NA | NA |
0.312 NA | NA |
0.289 NA | NA |
0.000 NA | NA |
|||
| Plot | Lyso | Other | |||||||||||
| Expt D |
1 peptide |
1 spectrum |
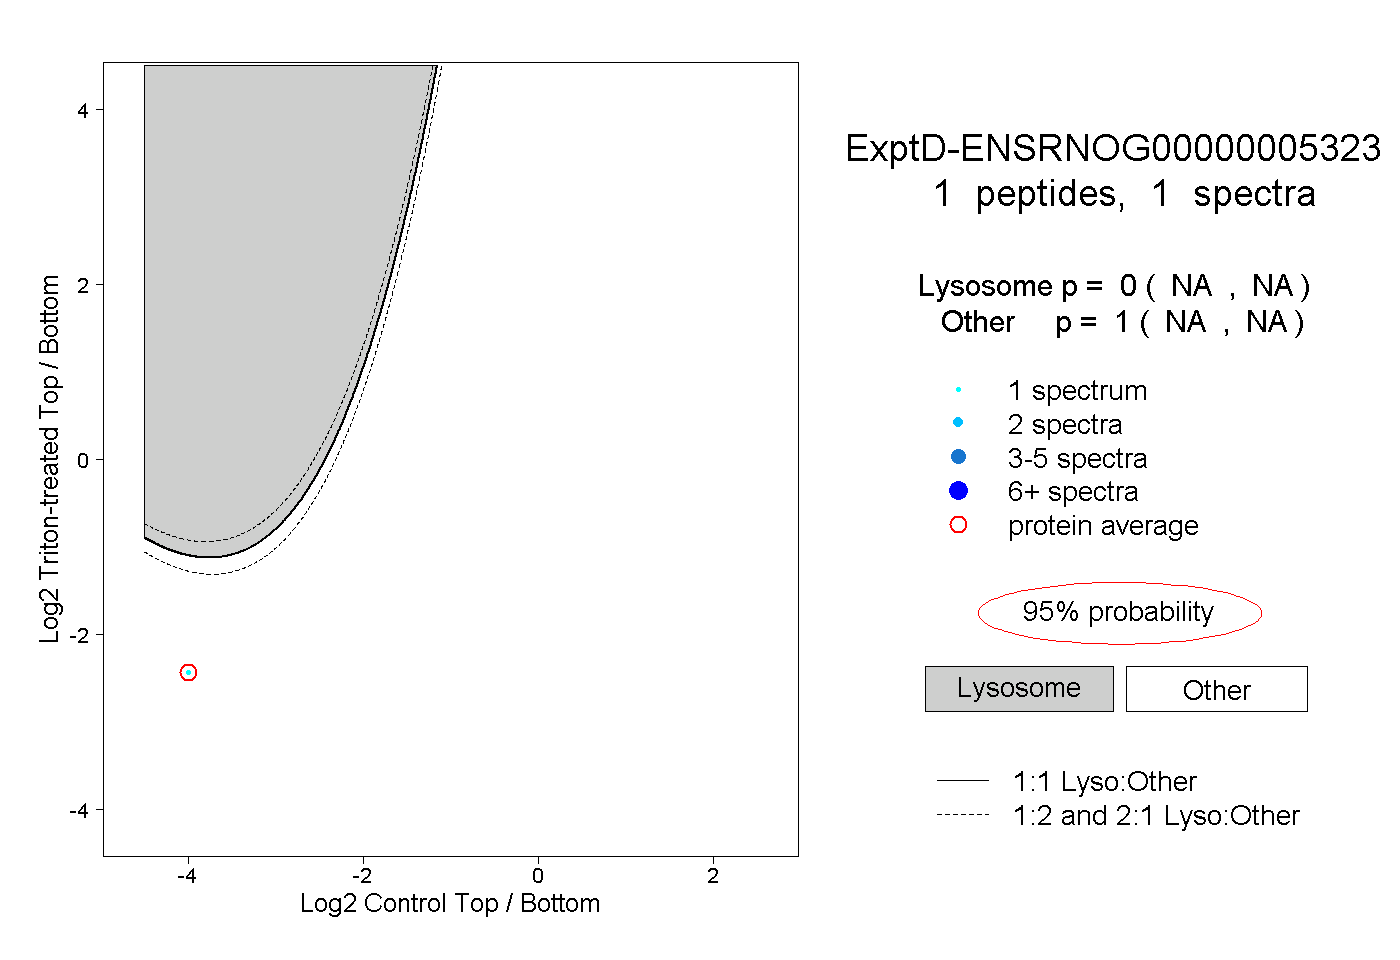 |
0.000 NA | NA |
1.000 NA | NA |