 6
6peptides
spectra
0.042 | 0.085
0.000 | 0.000
0.064 | 0.117
0.000 | 0.000
0.000 | 0.007
0.396 | 0.440
0.394 | 0.439
0.000 | 0.000
6peptides
spectra
0.000 | 0.000
1.000 | 1.000
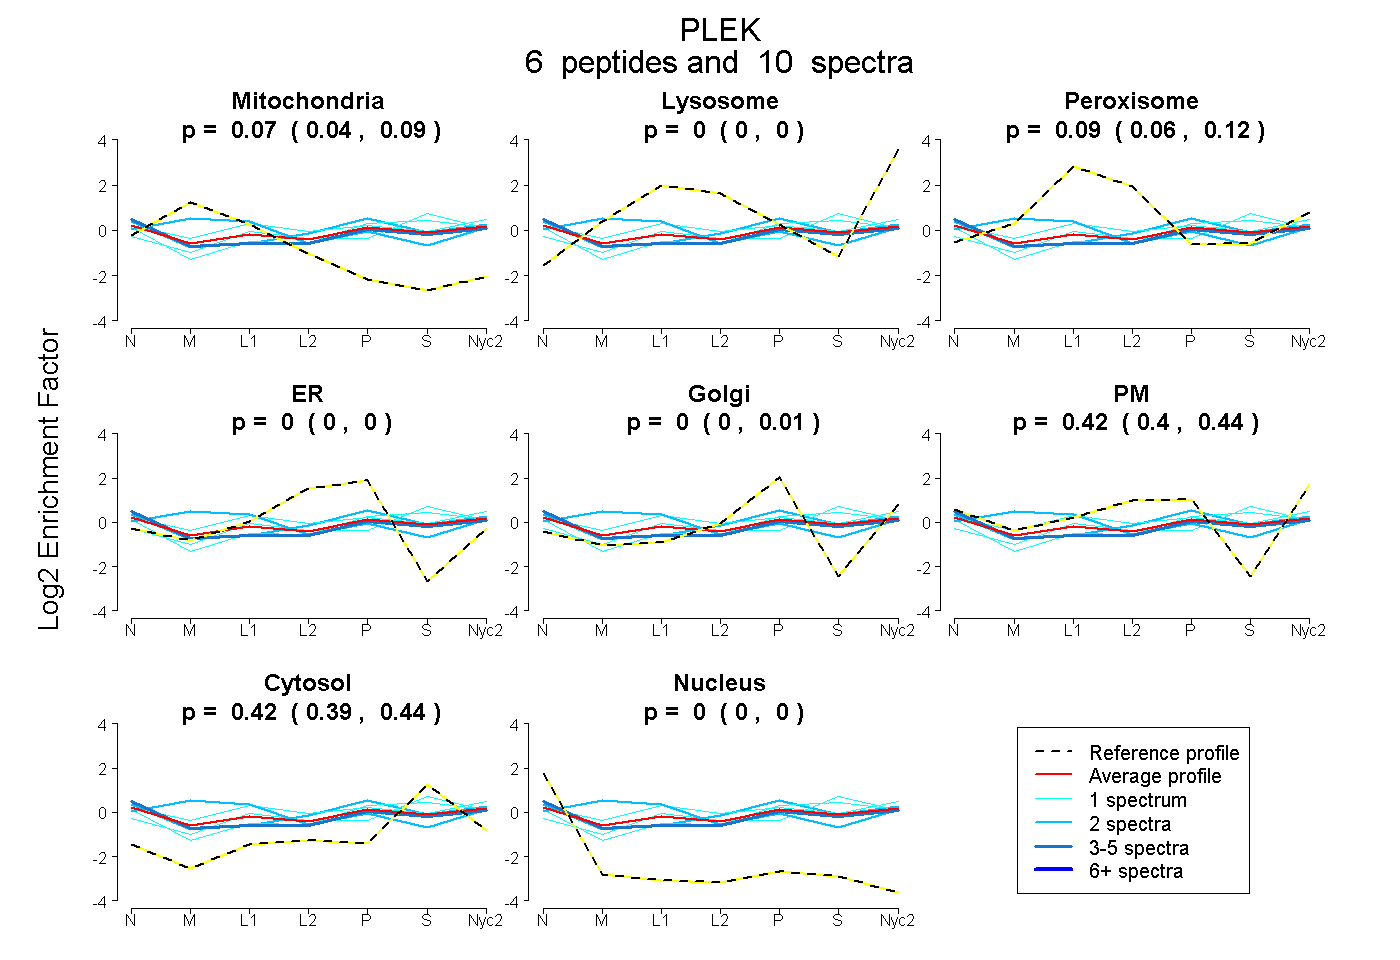
| Plot | Mito | Lyso | Perox | ER | Golgi | PM | Cytosol | Nucleus | |||||
| Expt A |
6 peptides |
10 spectra |
|
0.065 0.042 | 0.085 |
0.000 0.000 | 0.000 |
0.093 0.064 | 0.117 |
0.000 0.000 | 0.000 |
0.000 0.000 | 0.007 |
0.421 0.396 | 0.440 |
0.421 0.394 | 0.439 |
0.000 0.000 | 0.000 |
||
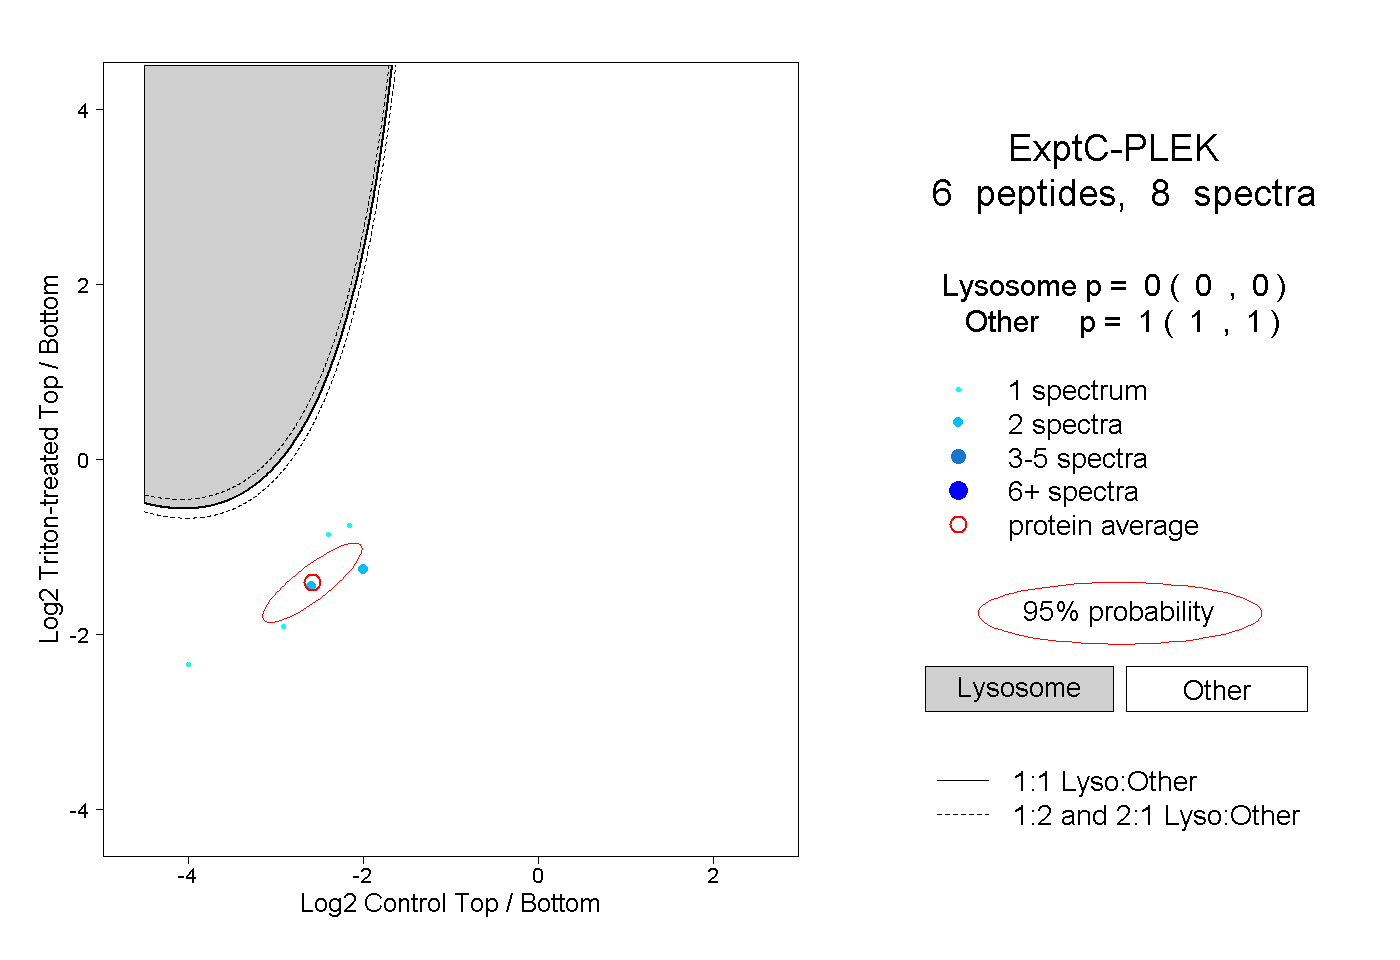
| Plot | Lyso | Other | |||||||||||
| Expt C |
6 peptides |
8 spectra |
|
0.000 0.000 | 0.000 |
1.000 1.000 | 1.000 |
| 1 spectrum, GMIPLK | 0.000 | 1.000 | ||||||||
| 2 spectra, EGYLVK | 0.000 | 1.000 | ||||||||
| 1 spectrum, CIEGGQK | 0.000 | 1.000 | ||||||||
| 2 spectra, QGCLLK | 0.000 | 1.000 | ||||||||
| 1 spectrum, GCVVTSVESNPDGK | 0.000 | 1.000 | ||||||||
| 1 spectrum, SDNNPK | 0.000 | 1.000 |