 3
3peptides
spectra
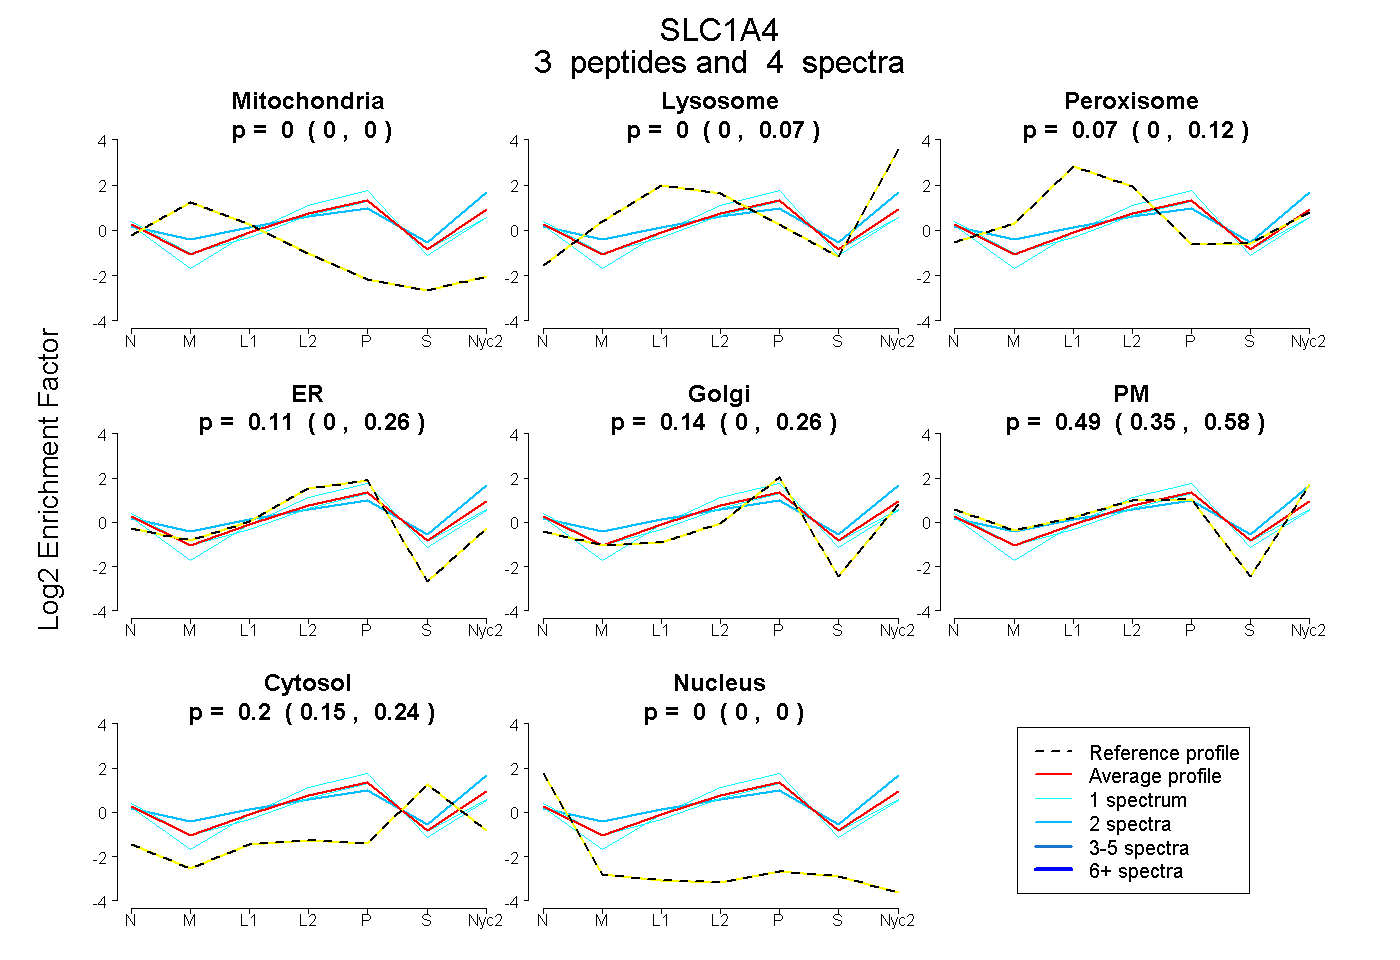
0.000 | 0.000
0.000 | 0.069
0.000 | 0.125
0.000 | 0.256
0.000 | 0.262
0.351 | 0.581
0.145 | 0.243
0.000 | 0.000
| Plot | Mito | Lyso | Perox | ER | Golgi | PM | Cytosol | Nucleus | |||||
| Expt A |
3 peptides |
4 spectra |
|
0.000 0.000 | 0.000 |
0.002 0.000 | 0.069 |
0.068 0.000 | 0.125 |
0.110 0.000 | 0.256 |
0.136 0.000 | 0.262 |
0.489 0.351 | 0.581 |
0.196 0.145 | 0.243 |
0.000 0.000 | 0.000 |
| 2 spectra, LGPEGDELIR | 0.000 | 0.204 | 0.000 | 0.000 | 0.000 | 0.581 | 0.215 | 0.000 | ||
| 1 spectrum, SEEETSPLVTHQNR | 0.000 | 0.000 | 0.000 | 0.226 | 0.038 | 0.492 | 0.244 | 0.000 | ||
| 1 spectrum, AGPVAVAPELESK | 0.000 | 0.000 | 0.000 | 0.463 | 0.049 | 0.304 | 0.184 | 0.000 |
| Plot | Lyso | Other | |||||||||||
| Expt C |
4 peptides |
13 spectra |
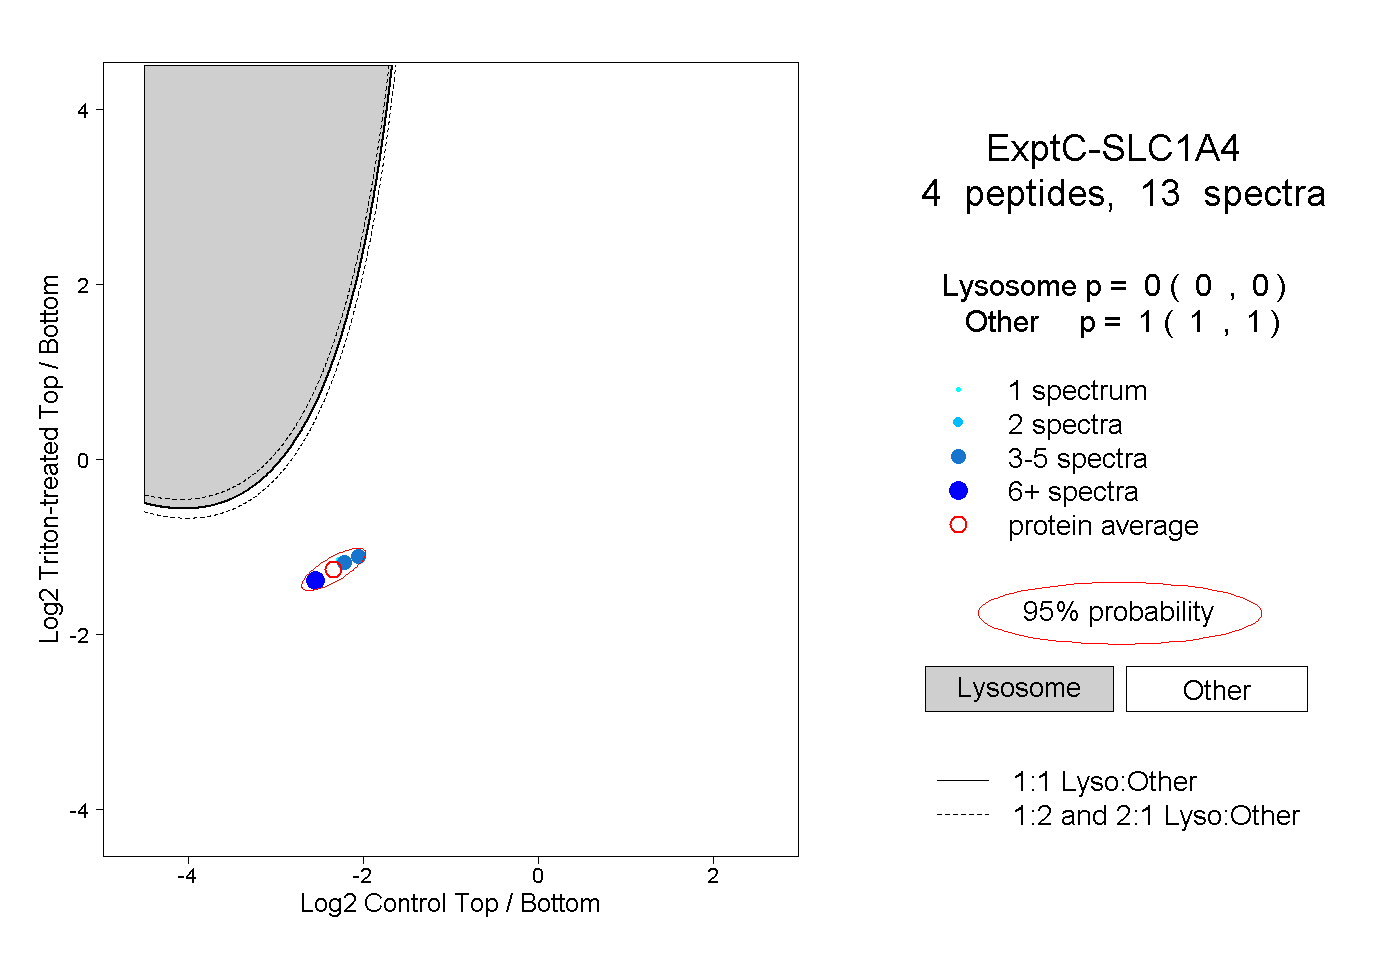 |
0.000 0.000 | 0.000 |
1.000 1.000 | 1.000 |