 24
24peptides
spectra
0.000 | 0.000
0.000 | 0.000
0.000 | 0.000
0.839 | 0.859
0.050 | 0.073
0.000 | 0.000
0.021 | 0.039
0.051 | 0.061
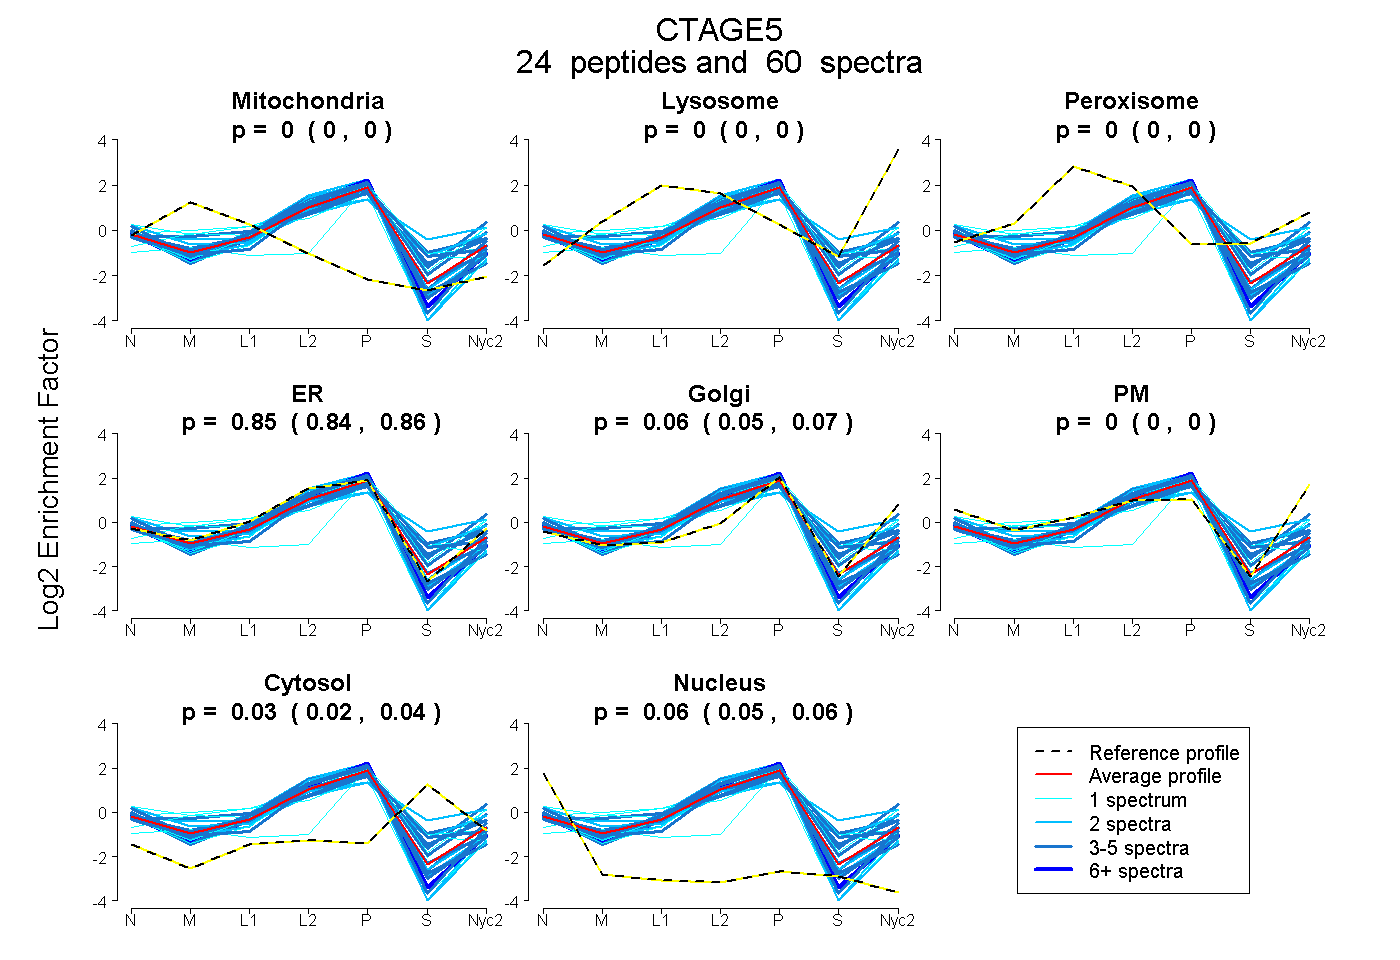
| Plot | Mito | Lyso | Perox | ER | Golgi | PM | Cytosol | Nucleus | |||||
| Expt A |
24 peptides |
60 spectra |
|
0.000 0.000 | 0.000 |
0.000 0.000 | 0.000 |
0.000 0.000 | 0.000 |
0.849 0.839 | 0.859 |
0.063 0.050 | 0.073 |
0.000 0.000 | 0.000 |
0.032 0.021 | 0.039 |
0.056 0.051 | 0.061 |
| 3 spectra, LEDEILLLEK | 0.000 | 0.000 | 0.000 | 0.922 | 0.000 | 0.000 | 0.000 | 0.078 | ||
| 2 spectra, ETQIESLIK | 0.000 | 0.000 | 0.000 | 0.933 | 0.000 | 0.000 | 0.000 | 0.067 | ||
| 2 spectra, IQSLEDESK | 0.033 | 0.000 | 0.000 | 0.905 | 0.000 | 0.000 | 0.000 | 0.062 | ||
| 8 spectra, DLEEELER | 0.000 | 0.000 | 0.000 | 0.922 | 0.000 | 0.000 | 0.000 | 0.078 | ||
| 2 spectra, LNASLK | 0.000 | 0.000 | 0.000 | 0.551 | 0.000 | 0.233 | 0.216 | 0.000 | ||
| 1 spectrum, AGPGAAAGCAR | 0.160 | 0.000 | 0.000 | 0.817 | 0.000 | 0.000 | 0.000 | 0.022 | ||
| 4 spectra, SQVAEAK | 0.000 | 0.000 | 0.000 | 0.947 | 0.000 | 0.000 | 0.000 | 0.053 | ||
| 3 spectra, VSFVQK | 0.000 | 0.000 | 0.000 | 0.770 | 0.000 | 0.000 | 0.230 | 0.000 | ||
| 2 spectra, IFEINEER | 0.000 | 0.000 | 0.000 | 0.938 | 0.000 | 0.000 | 0.000 | 0.062 | ||
| 3 spectra, AQAEQVLSEK | 0.000 | 0.049 | 0.017 | 0.492 | 0.214 | 0.115 | 0.113 | 0.000 | ||
| 3 spectra, VTLEESR | 0.000 | 0.000 | 0.000 | 0.925 | 0.000 | 0.000 | 0.000 | 0.075 | ||
| 1 spectrum, VITELYQENEMK | 0.000 | 0.000 | 0.000 | 0.634 | 0.282 | 0.000 | 0.084 | 0.000 | ||
| 1 spectrum, MTAHPPPGQPYSDPVPQR | 0.046 | 0.000 | 0.000 | 0.000 | 0.694 | 0.000 | 0.260 | 0.000 | ||
| 3 spectra, LTETEFK | 0.153 | 0.000 | 0.000 | 0.765 | 0.054 | 0.000 | 0.016 | 0.011 | ||
| 2 spectra, DHTGPDCR | 0.000 | 0.000 | 0.000 | 0.967 | 0.000 | 0.000 | 0.000 | 0.033 | ||
| 5 spectra, EASFEK | 0.000 | 0.000 | 0.000 | 0.782 | 0.160 | 0.000 | 0.000 | 0.058 | ||
| 2 spectra, EQVSDLDK | 0.000 | 0.000 | 0.026 | 0.394 | 0.058 | 0.211 | 0.311 | 0.000 | ||
| 3 spectra, EYEGLESSLK | 0.000 | 0.000 | 0.000 | 0.846 | 0.036 | 0.032 | 0.087 | 0.000 | ||
| 1 spectrum, ISHAAEELETYR | 0.211 | 0.000 | 0.000 | 0.695 | 0.094 | 0.000 | 0.000 | 0.000 | ||
| 3 spectra, TIHSYQGQVISHEK | 0.000 | 0.000 | 0.000 | 0.709 | 0.042 | 0.066 | 0.181 | 0.003 | ||
| 1 spectrum, QLLQEAEIMK | 0.107 | 0.000 | 0.000 | 0.893 | 0.000 | 0.000 | 0.000 | 0.000 | ||
| 3 spectra, HSEQDELMADISK | 0.000 | 0.000 | 0.000 | 0.751 | 0.007 | 0.000 | 0.242 | 0.000 | ||
| 1 spectrum, LTVEENYR | 0.000 | 0.000 | 0.000 | 0.760 | 0.000 | 0.000 | 0.234 | 0.006 | ||
| 1 spectrum, EDLTEHIK | 0.000 | 0.000 | 0.000 | 0.608 | 0.315 | 0.025 | 0.051 | 0.000 |
| Plot | Mito | Lyso or Perox | ER | Golgi | PM | Cytosol | Nucleus | ||||||
| Expt B |
14 peptides |
28 spectra |
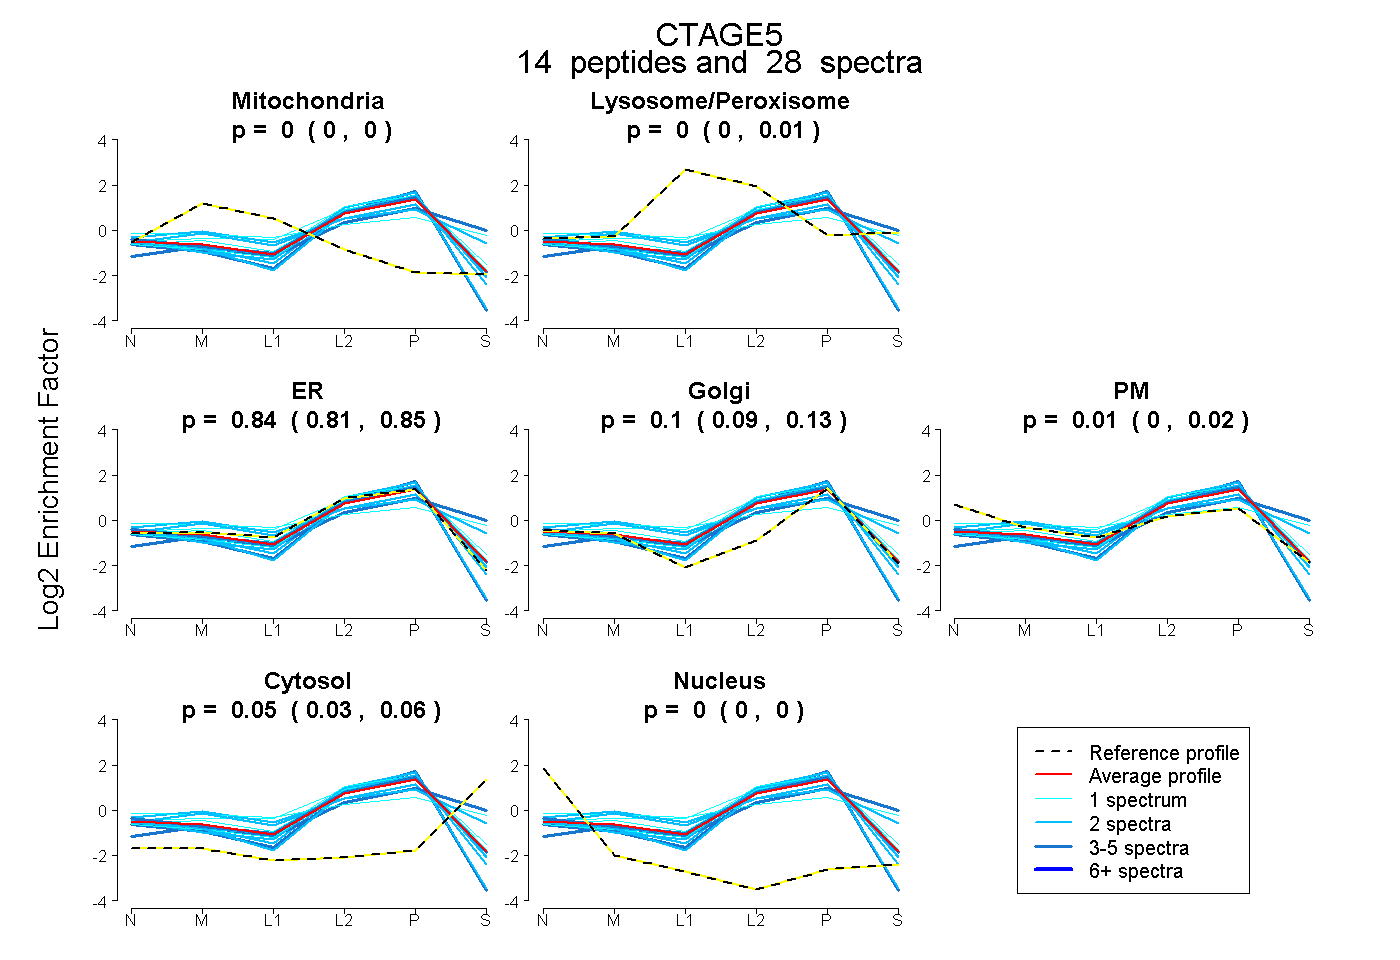 |
0.000 0.000 | 0.000 |
0.000 0.000 | 0.013 |
0.842 0.809 | 0.850 |
0.103 0.088 | 0.128 |
0.005 0.000 | 0.018 |
0.049 0.034 | 0.059 |
0.000 0.000 | 0.000 |
|||
| Plot | Lyso | Other | |||||||||||
| Expt C |
28 peptides |
109 spectra |
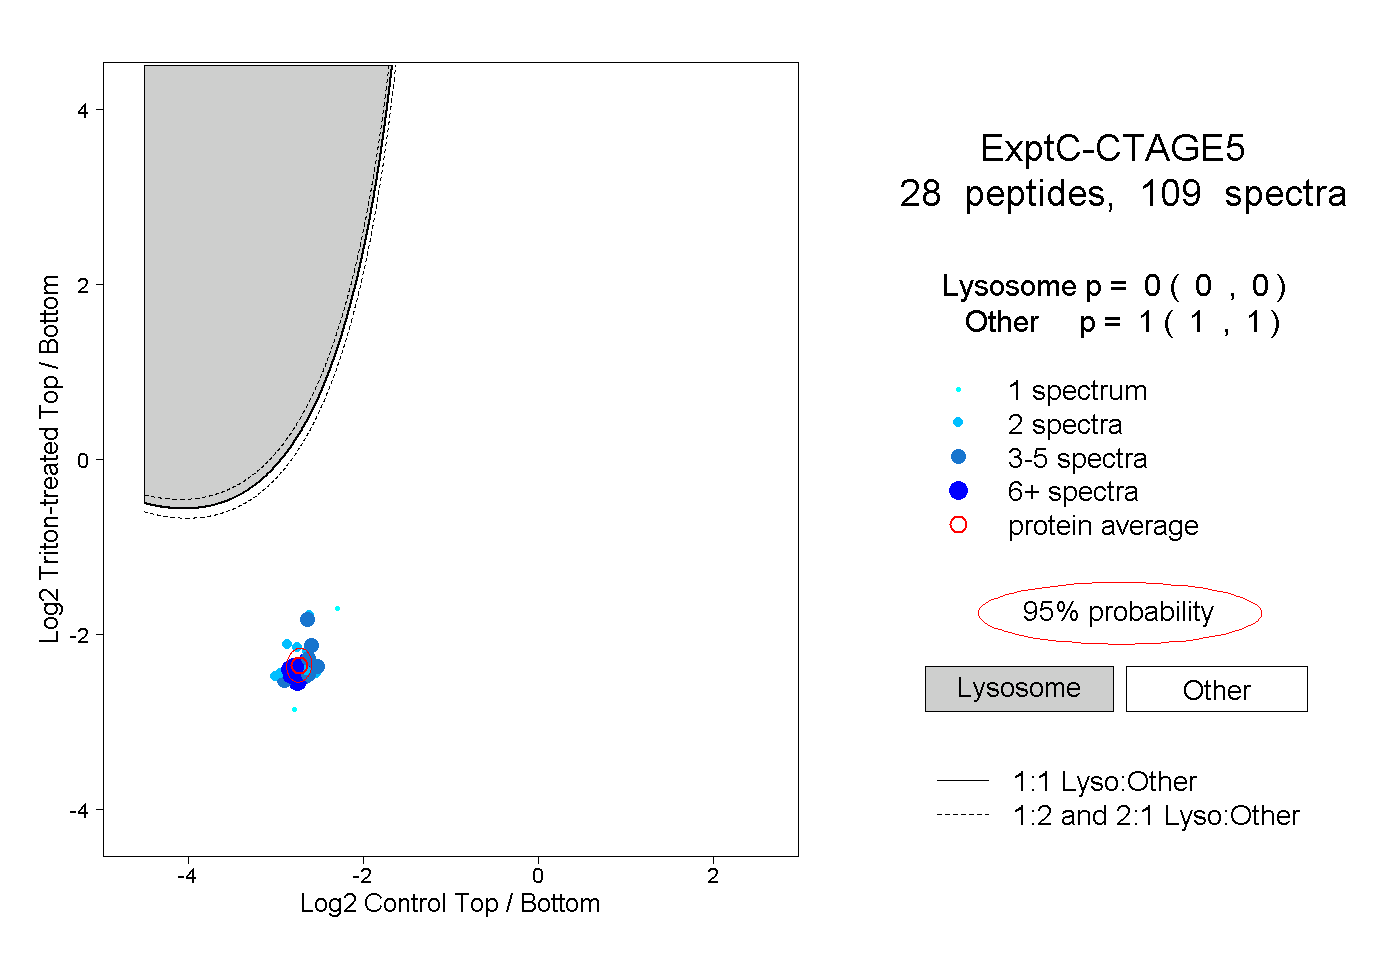 |
0.000 0.000 | 0.000 |
1.000 1.000 | 1.000 |
||||||||
| Plot | Lyso | Other | |||||||||||
| Expt D |
11 peptides |
21 spectra |
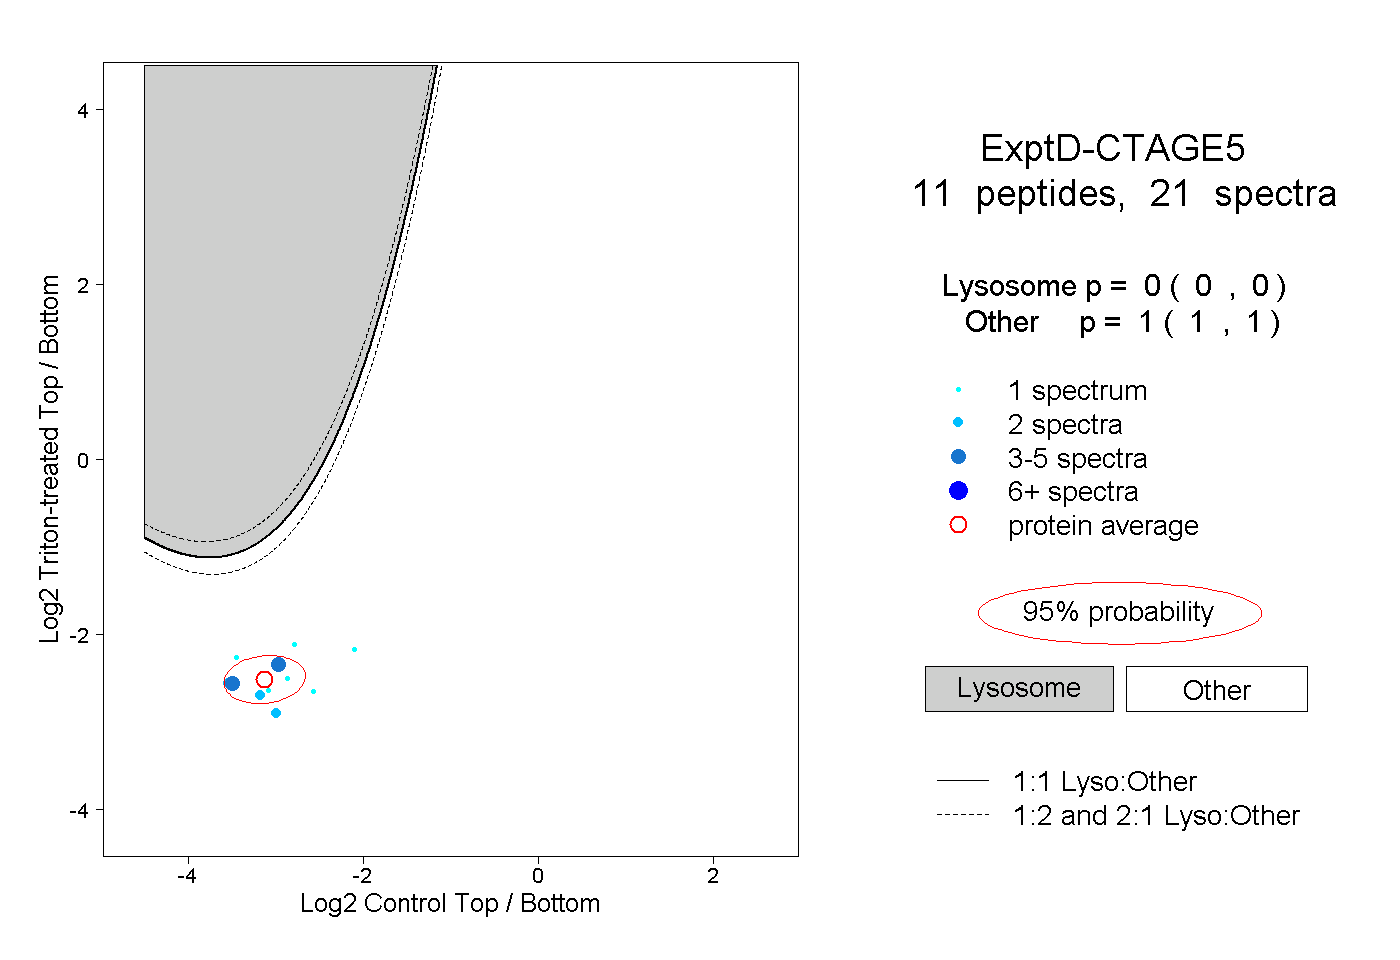 |
0.000 0.000 | 0.000 |
1.000 1.000 | 1.000 |