 3
3peptides
spectra
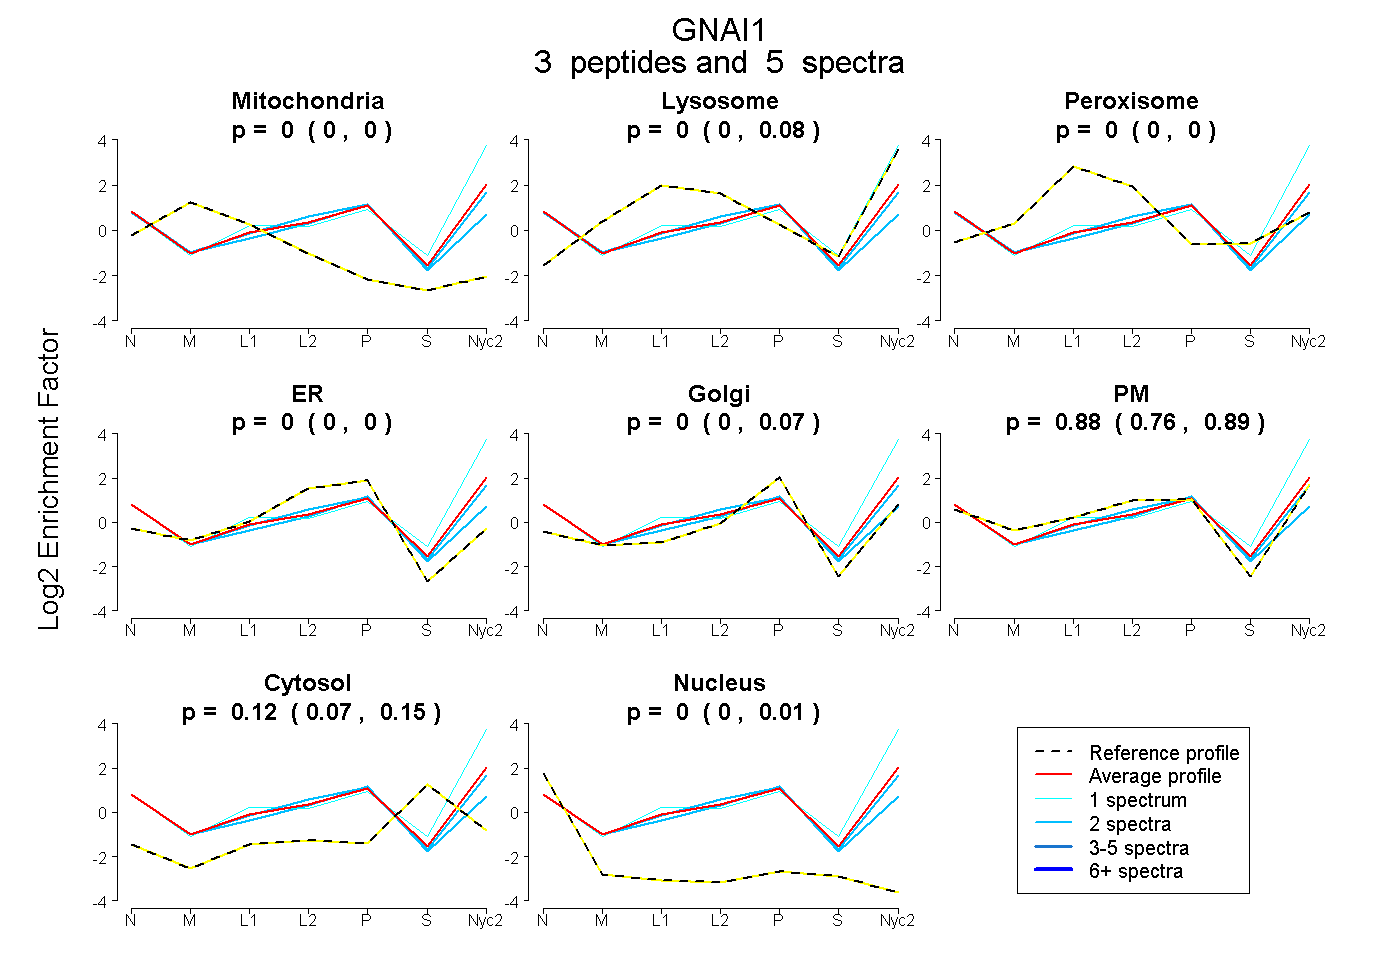
0.000 | 0.000
0.000 | 0.078
0.000 | 0.000
0.000 | 0.000
0.000 | 0.074
0.763 | 0.886
0.074 | 0.152
0.000 | 0.006
1peptide
spectra
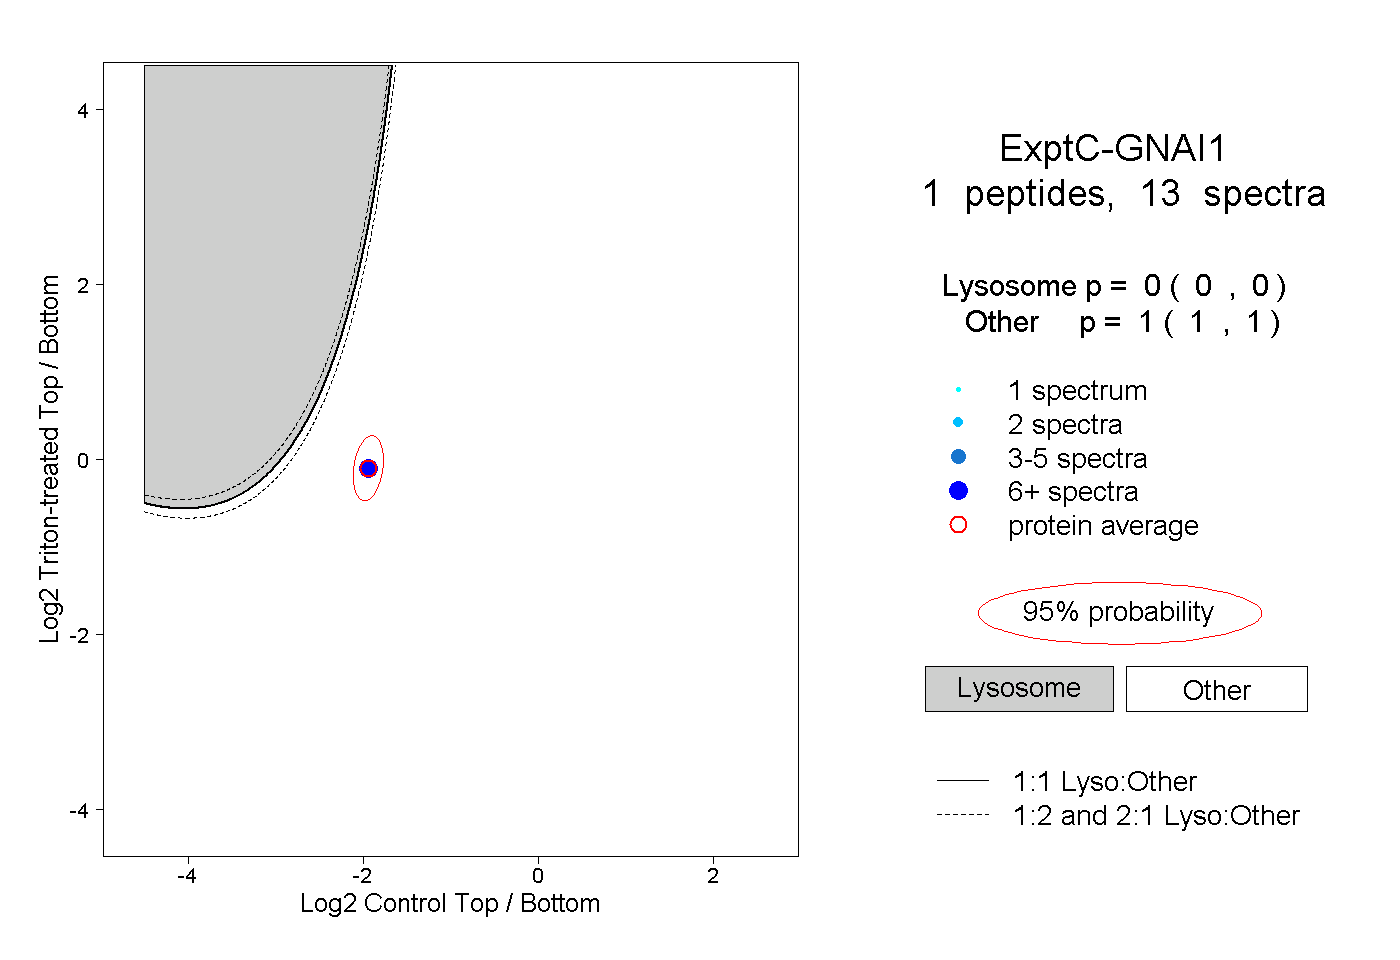
0.000 | 0.000
1.000 | 1.000
1peptide
spectra
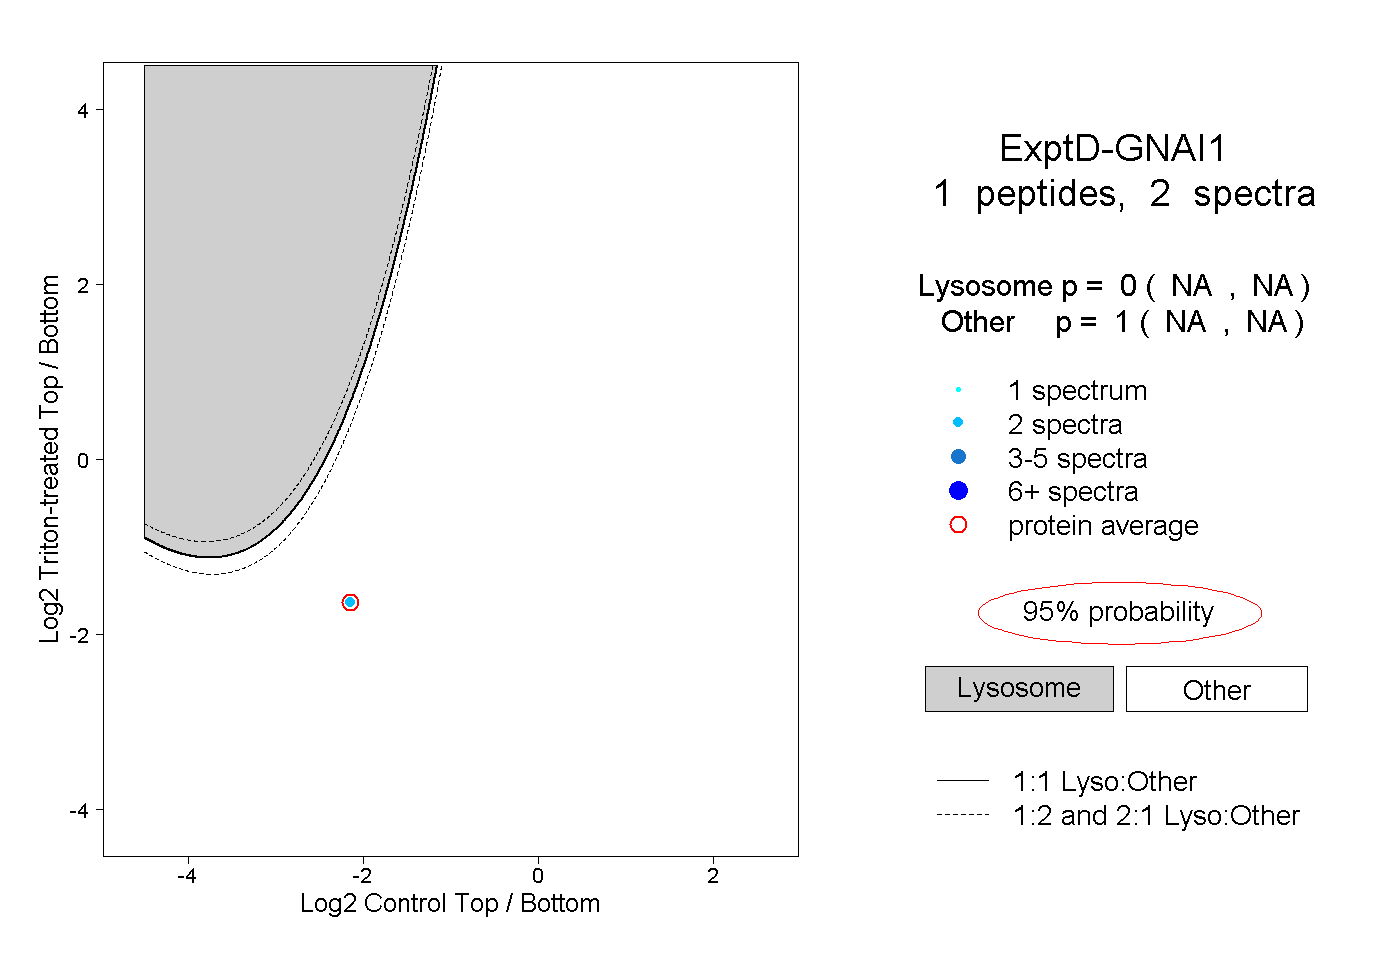
NA | NA
NA | NA