 2
2peptides
spectra
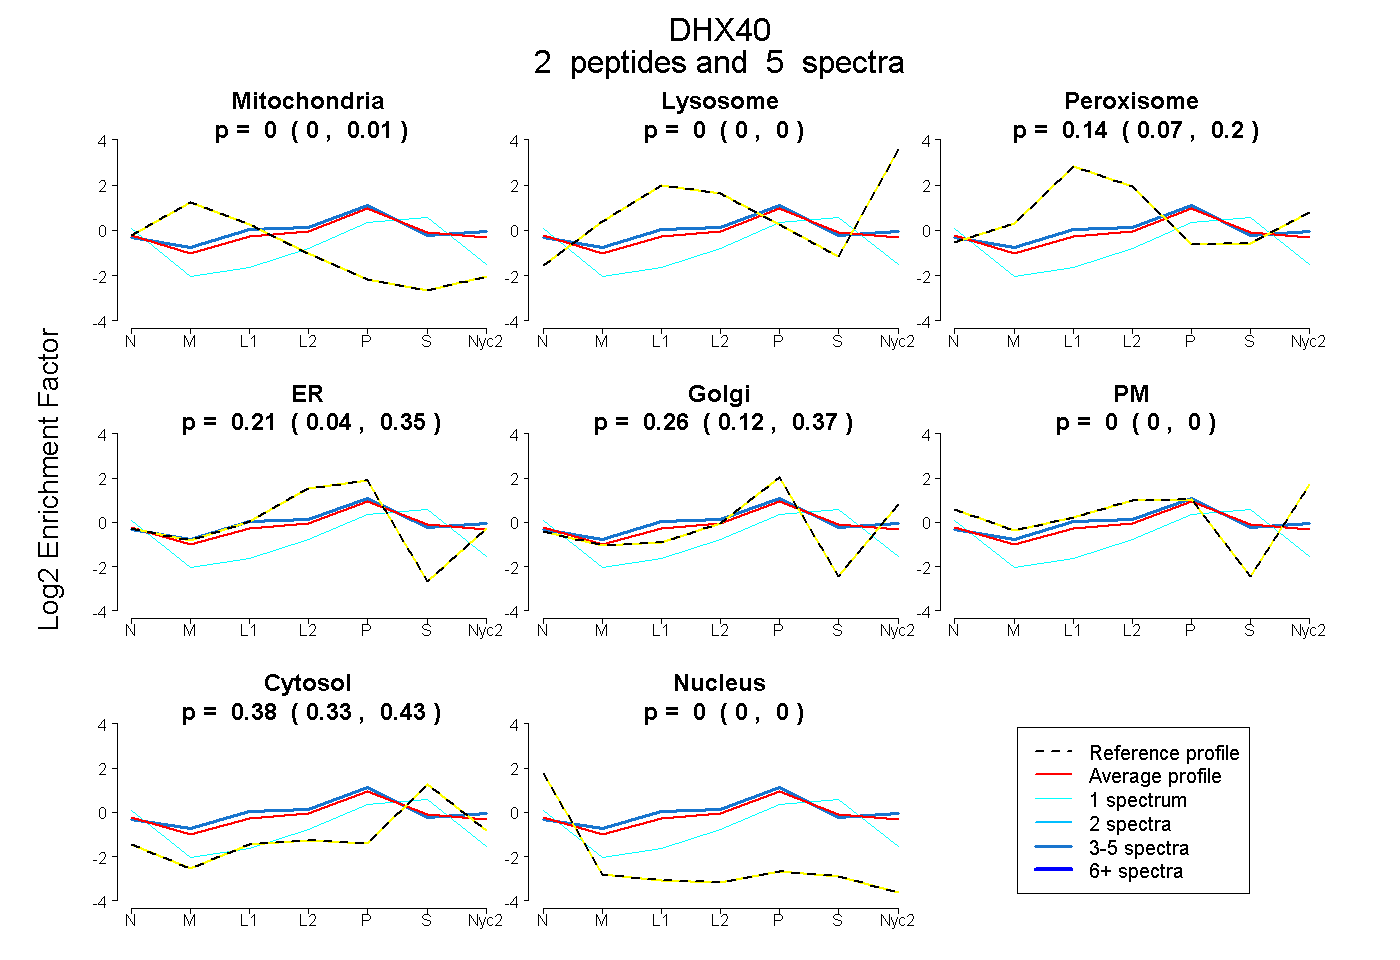
0.000 | 0.007
0.000 | 0.000
0.067 | 0.201
0.039 | 0.345
0.117 | 0.373
0.000 | 0.000
0.331 | 0.425
0.000 | 0.000
2peptides
spectra
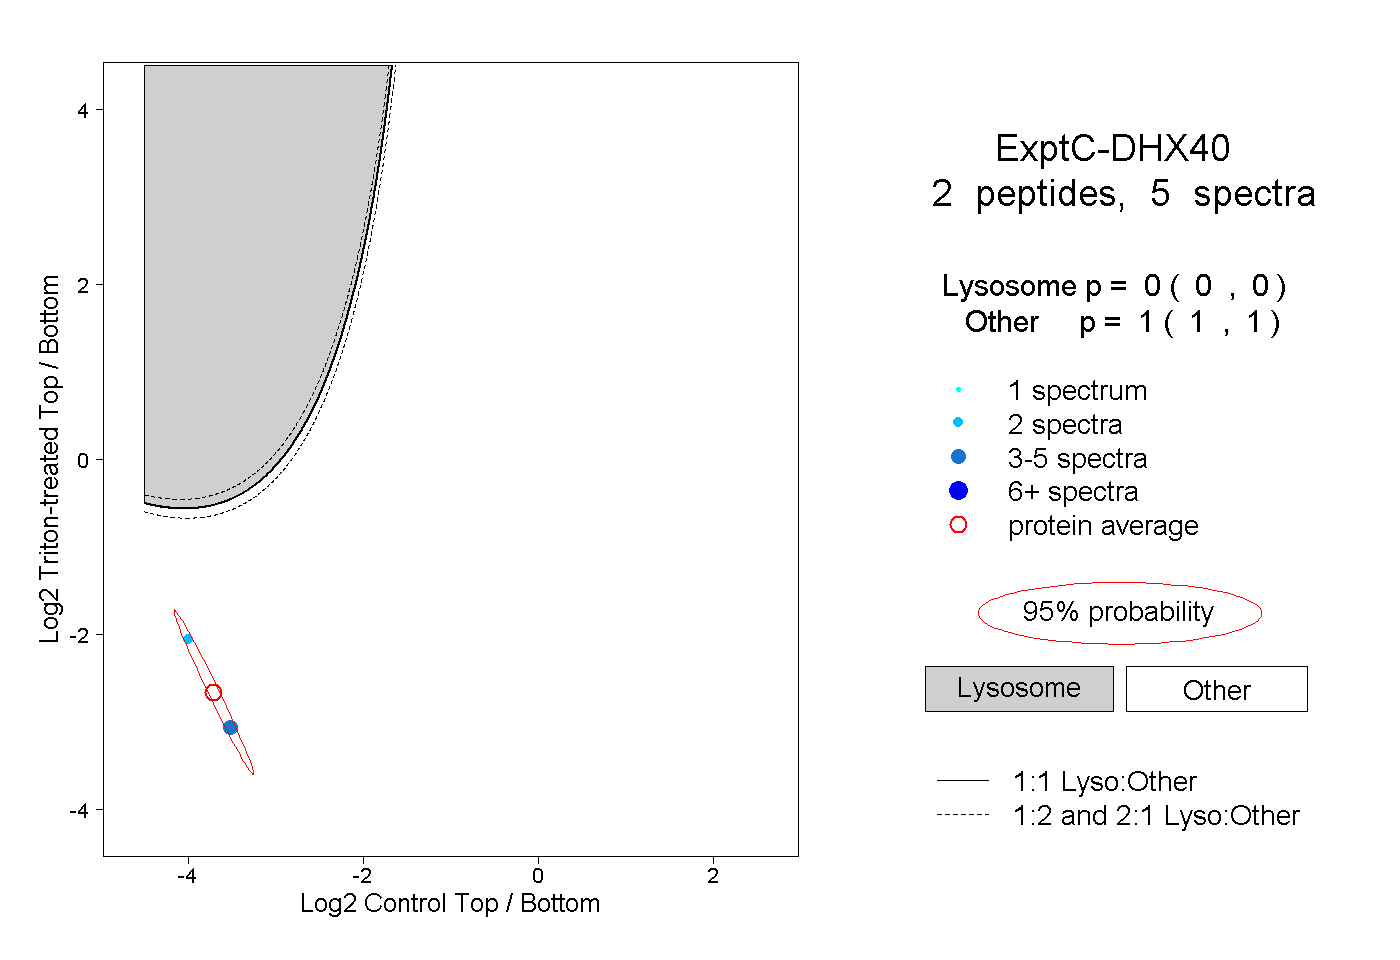
0.000 | 0.000
1.000 | 1.000
2peptides
spectra
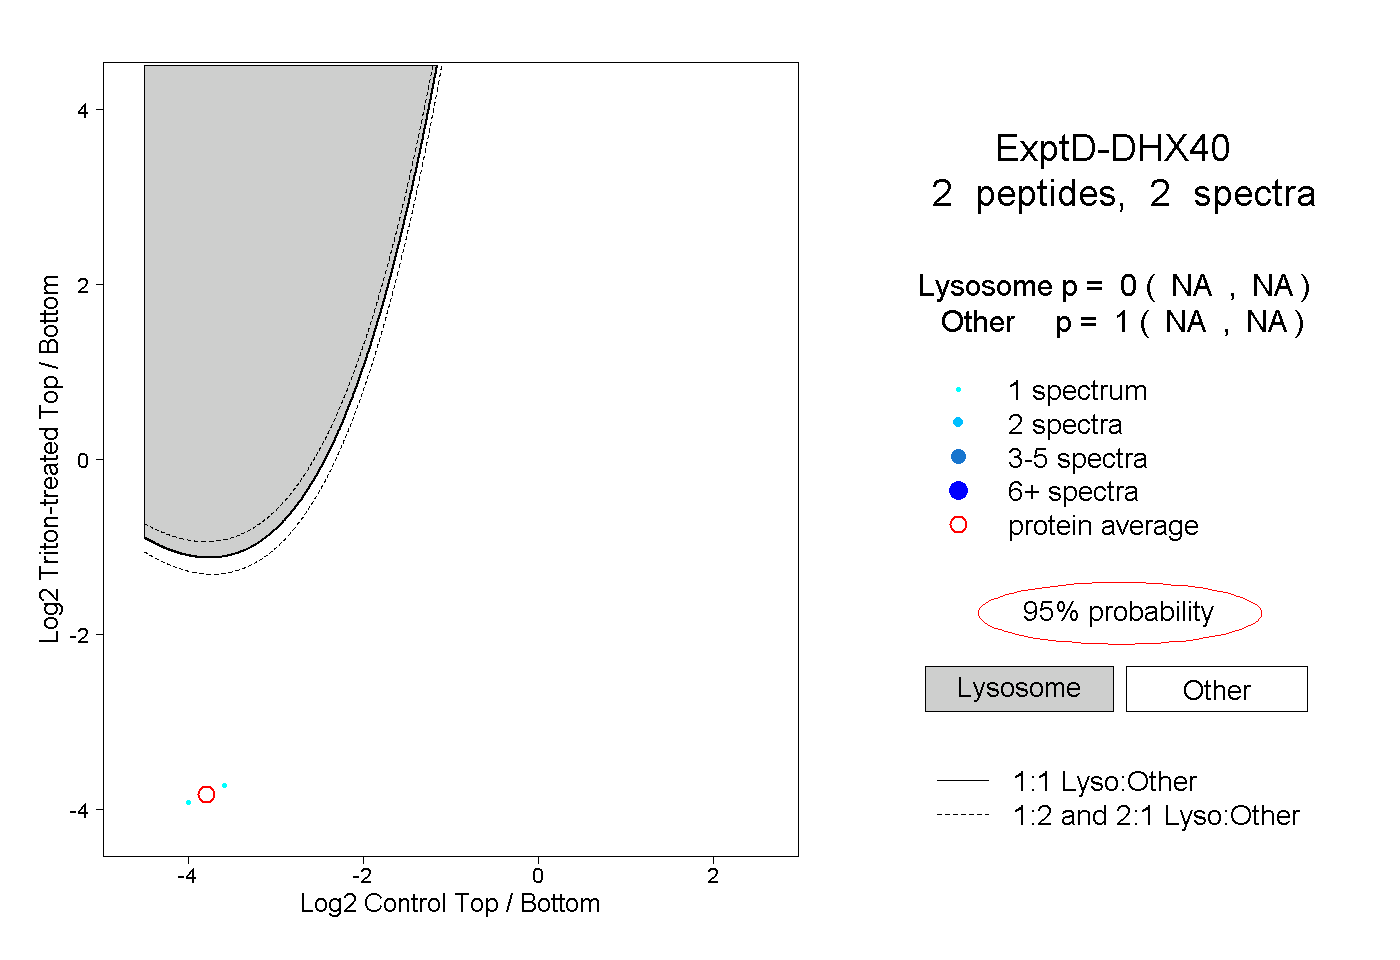
NA | NA
NA | NA