 5
5peptides
spectra
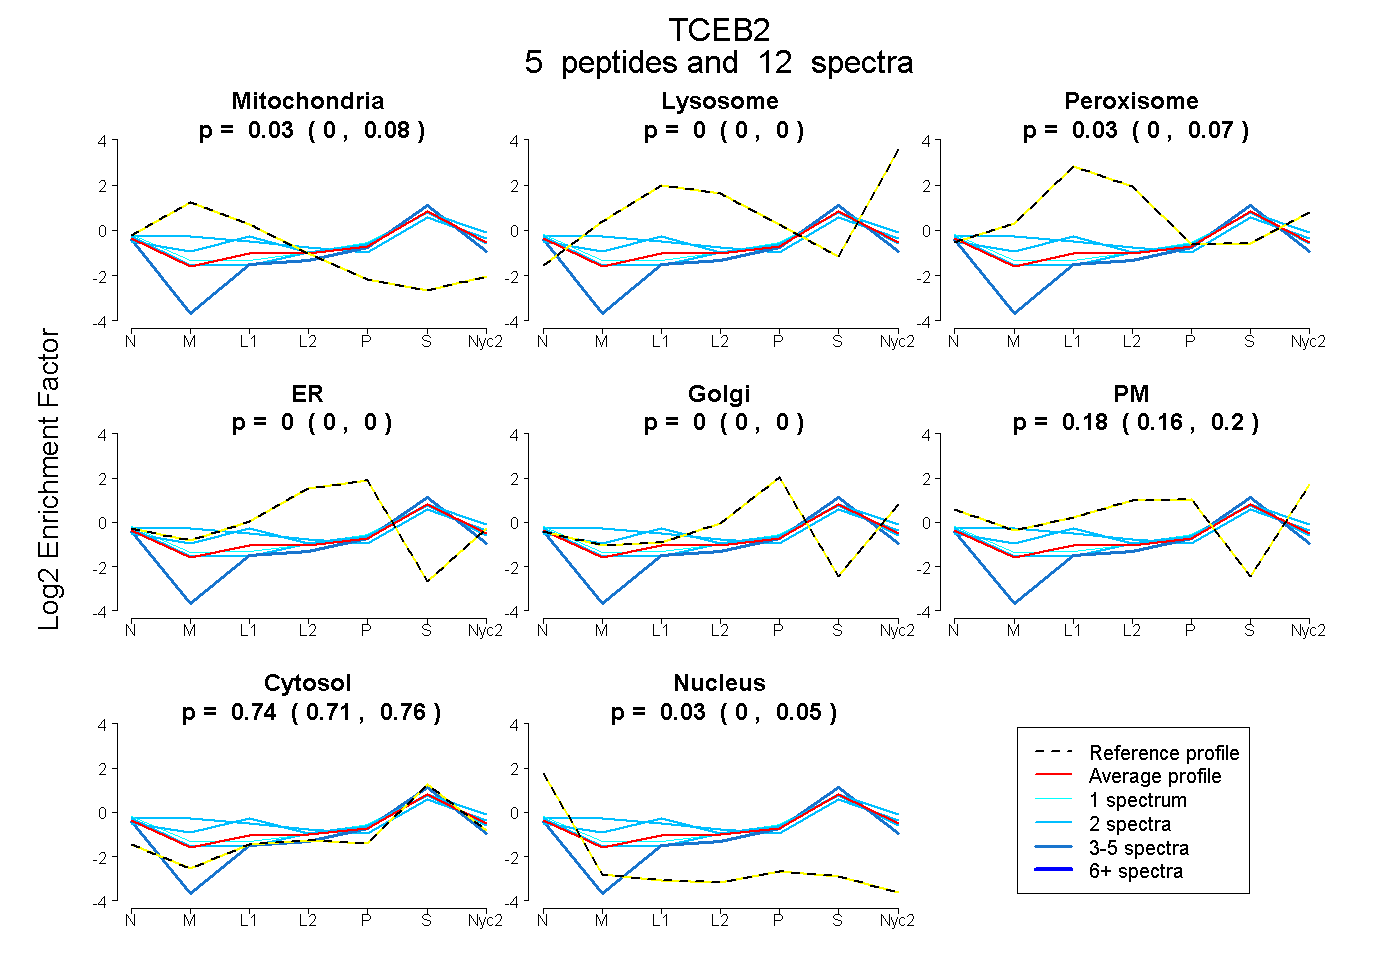
0.000 | 0.082
0.000 | 0.000
0.000 | 0.065
0.000 | 0.000
0.000 | 0.000
0.155 | 0.202
0.713 | 0.756
0.000 | 0.047
1peptide
spectra
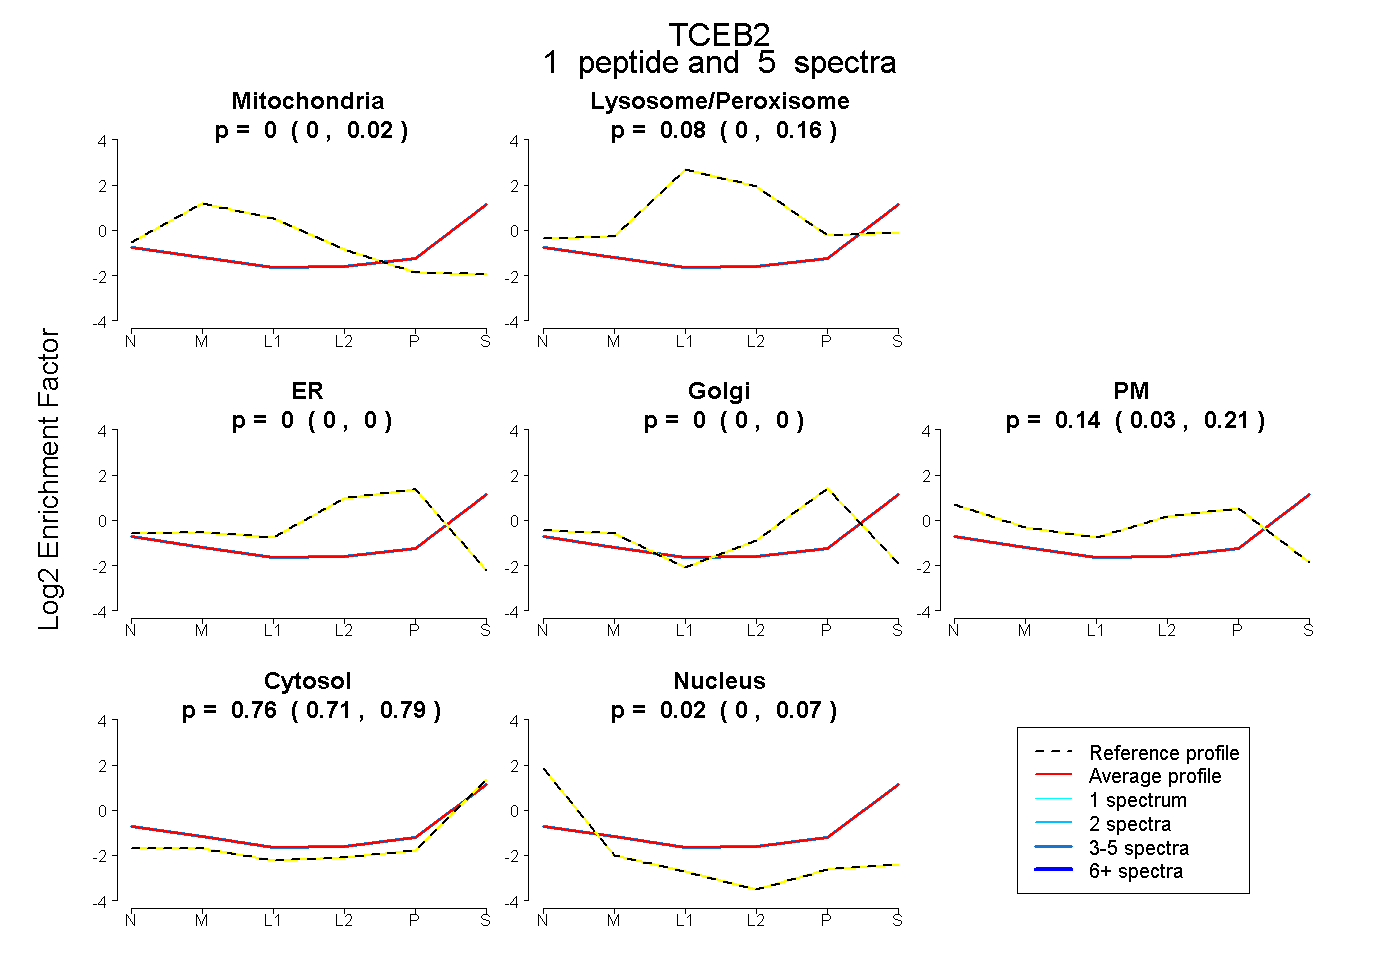
0.000 | 0.020
0.000 | 0.156
0.000 | 0.000
0.000 | 0.000
0.029 | 0.205
0.714 | 0.793
0.000 | 0.066
5peptides
spectra
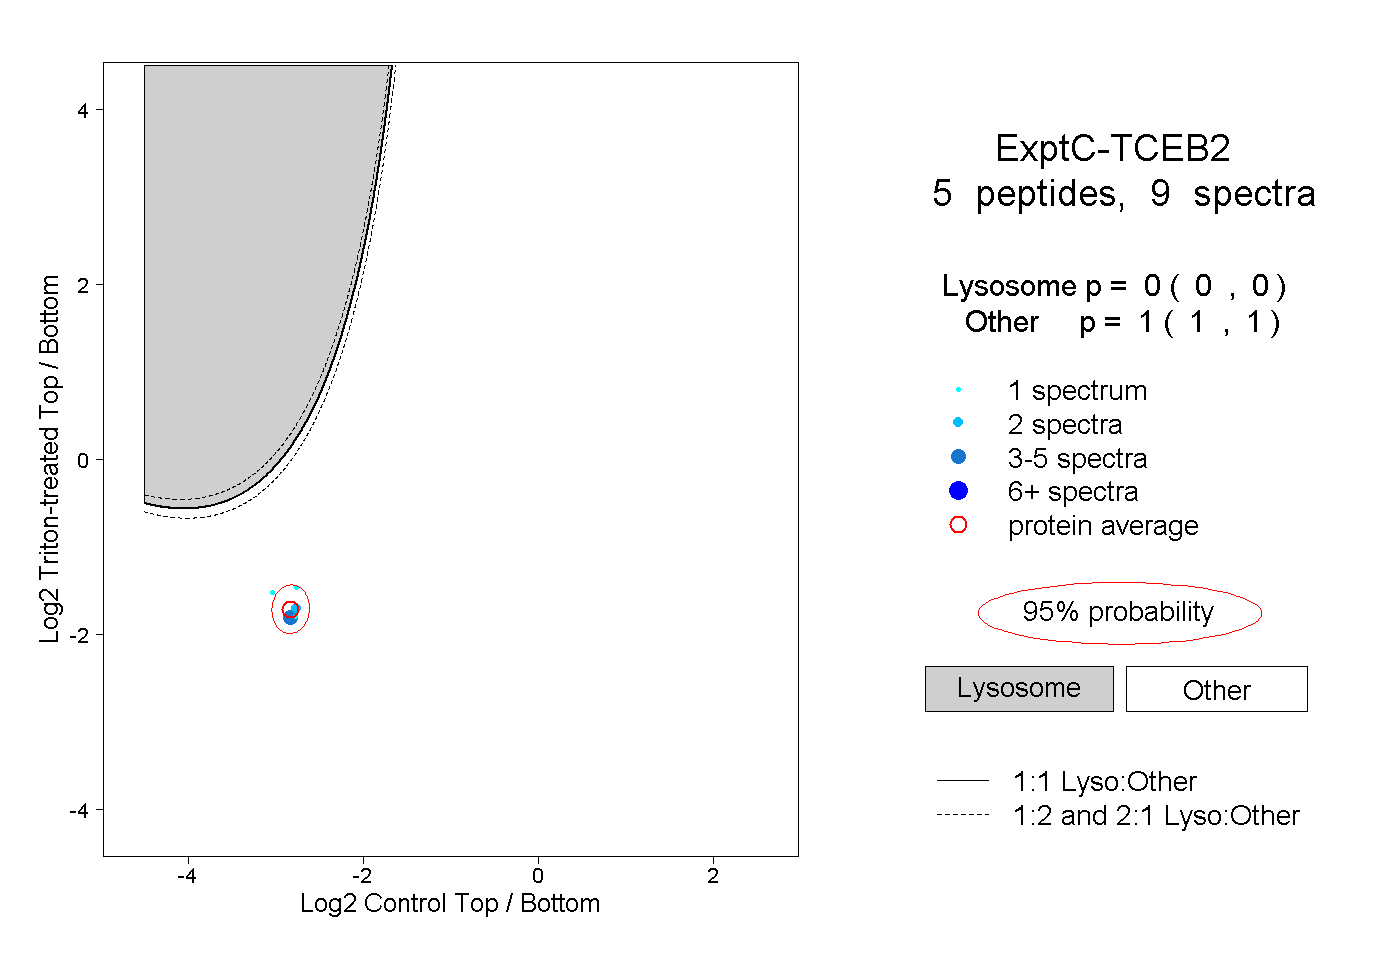
0.000 | 0.000
1.000 | 1.000