 5
5peptides
spectra
0.000 | 0.082
0.000 | 0.000
0.000 | 0.065
0.000 | 0.000
0.000 | 0.000
0.155 | 0.202
0.713 | 0.756
0.000 | 0.047
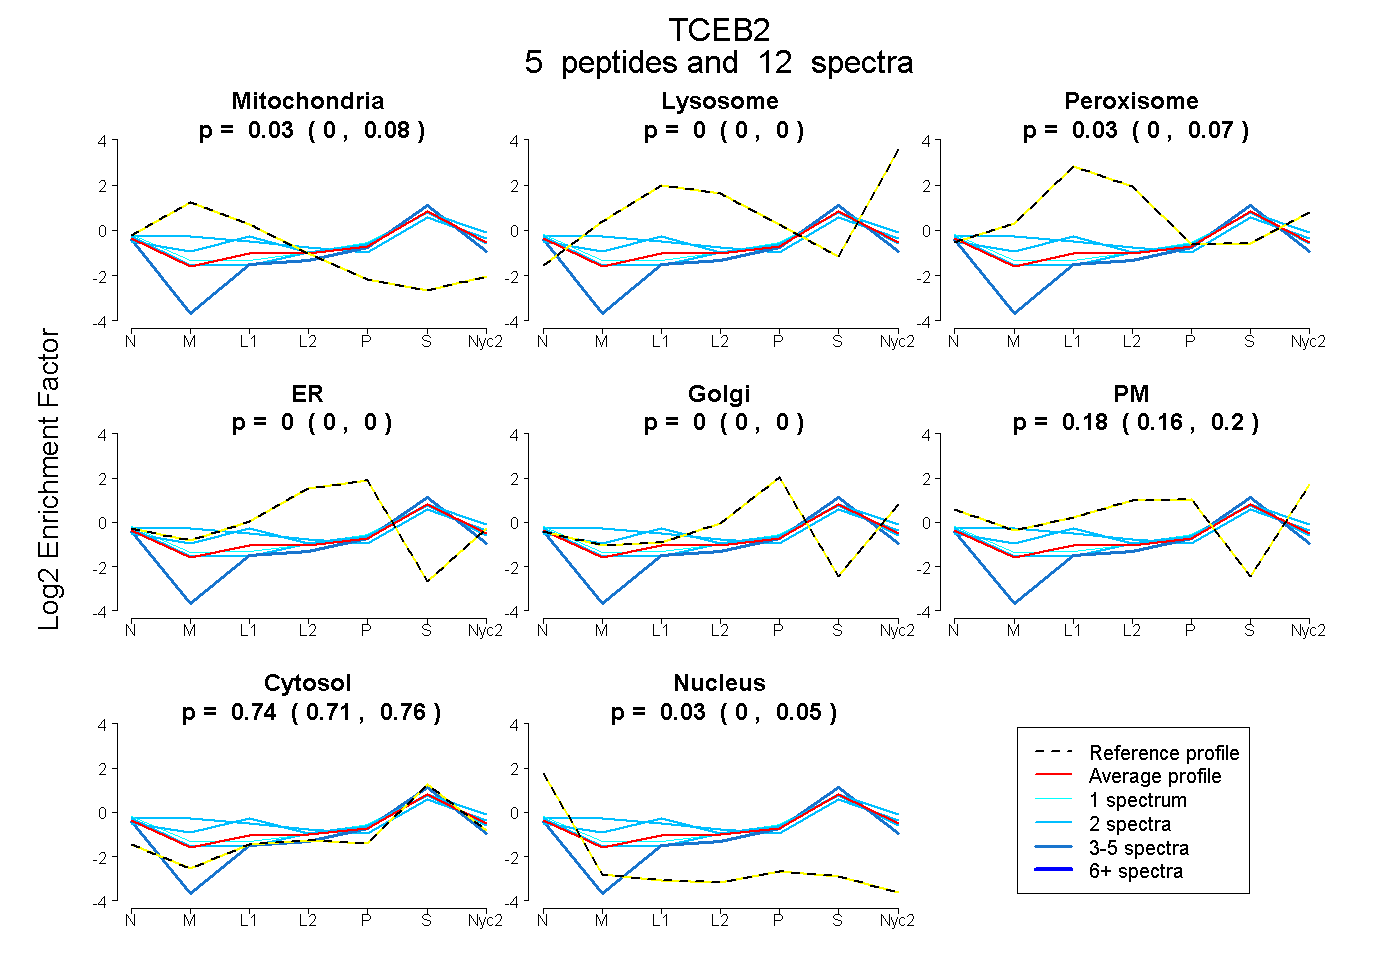
| Plot | Mito | Lyso | Perox | ER | Golgi | PM | Cytosol | Nucleus | |||||
| Expt A |
5 peptides |
12 spectra |
|
0.026 0.000 | 0.082 |
0.000 0.000 | 0.000 |
0.029 0.000 | 0.065 |
0.000 0.000 | 0.000 |
0.000 0.000 | 0.000 |
0.182 0.155 | 0.202 |
0.737 0.713 | 0.756 |
0.025 0.000 | 0.047 |
| 5 spectra, TLGECGFTSQTARPQAPATVGLAFR | 0.000 | 0.000 | 0.000 | 0.000 | 0.038 | 0.000 | 0.878 | 0.084 | ||
| 1 spectrum, IVEGILK | 0.026 | 0.000 | 0.000 | 0.000 | 0.000 | 0.232 | 0.713 | 0.030 | ||
| 2 spectra, TTIFTDAK | 0.062 | 0.018 | 0.169 | 0.000 | 0.000 | 0.122 | 0.629 | 0.000 | ||
| 2 spectra, ADDTFEALR | 0.197 | 0.001 | 0.153 | 0.000 | 0.000 | 0.111 | 0.538 | 0.000 | ||
| 2 spectra, ESSTVFELK | 0.000 | 0.000 | 0.000 | 0.000 | 0.009 | 0.207 | 0.728 | 0.056 |
| Plot | Mito | Lyso or Perox | ER | Golgi | PM | Cytosol | Nucleus | ||||||
| Expt B |
1 peptide |
5 spectra |
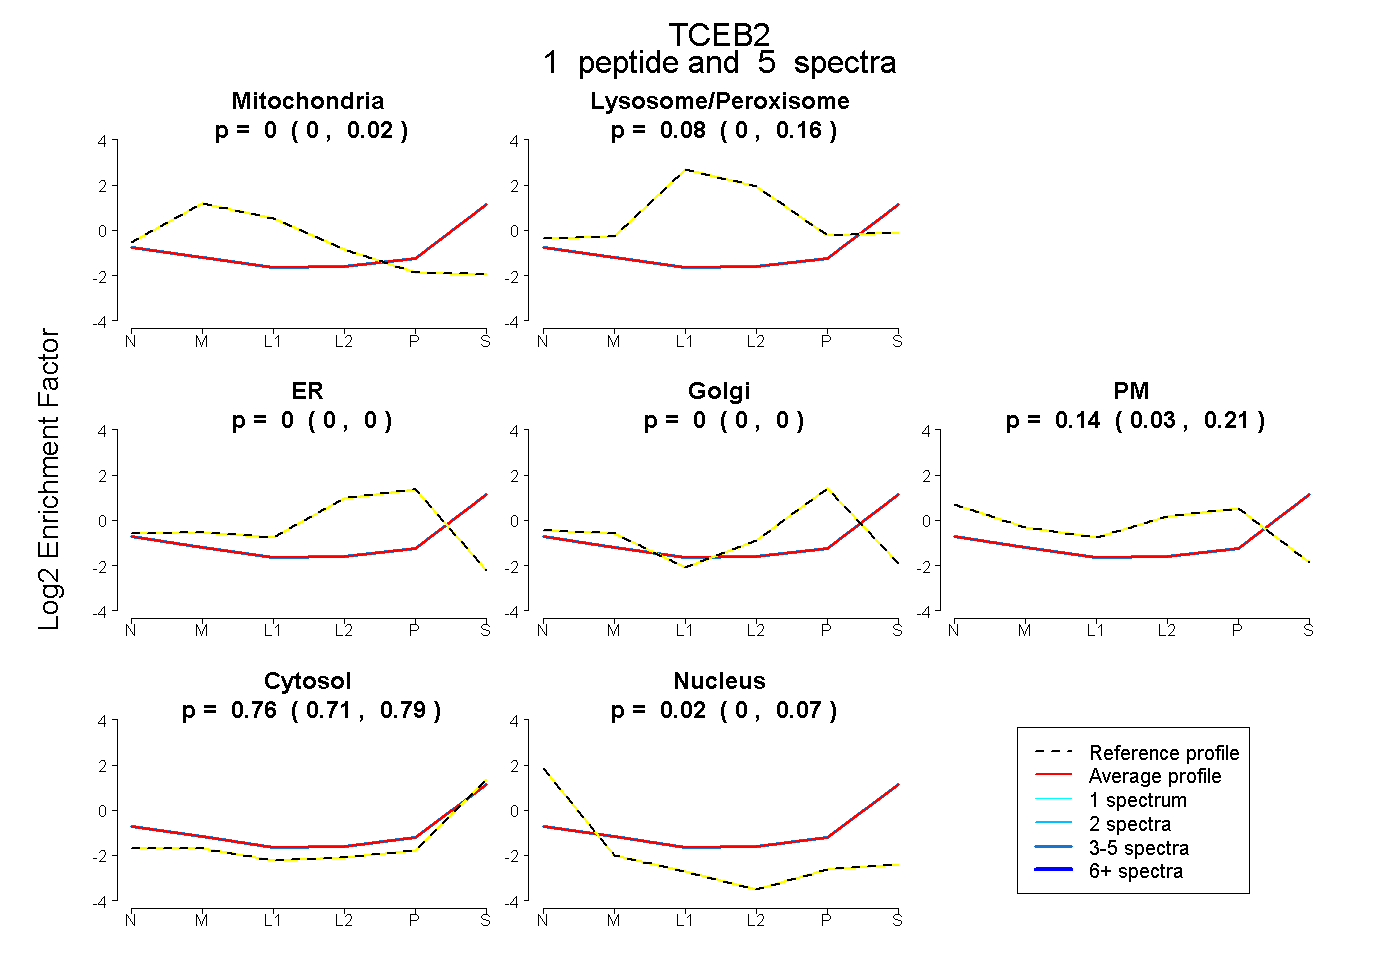 |
0.000 0.000 | 0.020 |
0.080 0.000 | 0.156 |
0.000 0.000 | 0.000 |
0.000 0.000 | 0.000 |
0.138 0.029 | 0.205 |
0.760 0.714 | 0.793 |
0.022 0.000 | 0.066 |
|||
| Plot | Lyso | Other | |||||||||||
| Expt C |
5 peptides |
9 spectra |
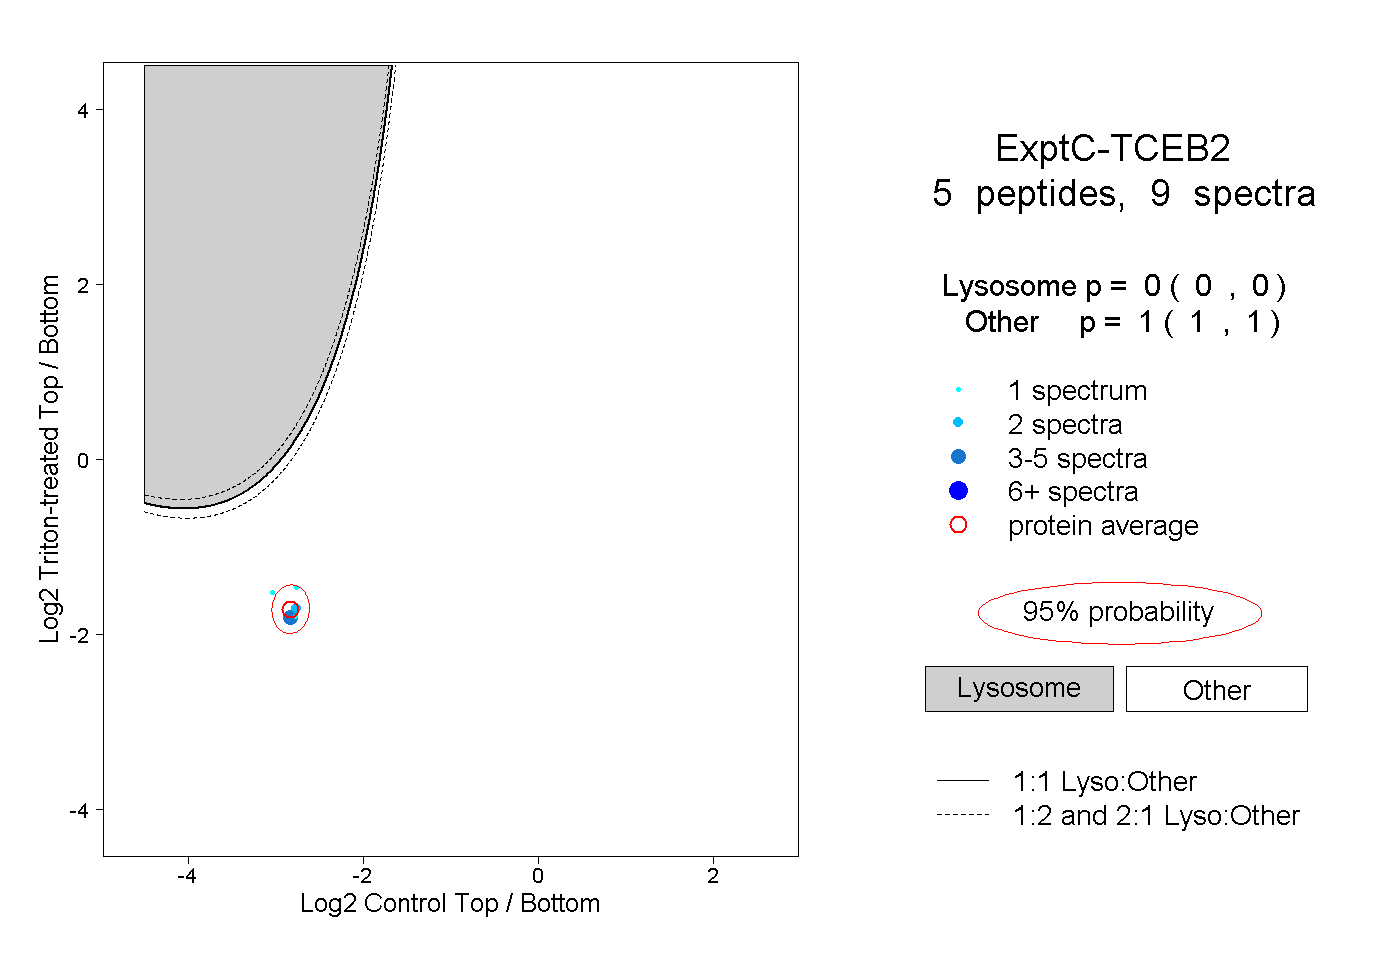 |
0.000 0.000 | 0.000 |
1.000 1.000 | 1.000 |