 15
15peptides
spectra
0.000 | 0.000
0.092 | 0.109
0.000 | 0.000
0.000 | 0.000
0.079 | 0.100
0.000 | 0.000
0.799 | 0.816
0.000 | 0.000
8peptides
spectra
0.000 | 0.000
1.000 | 1.000
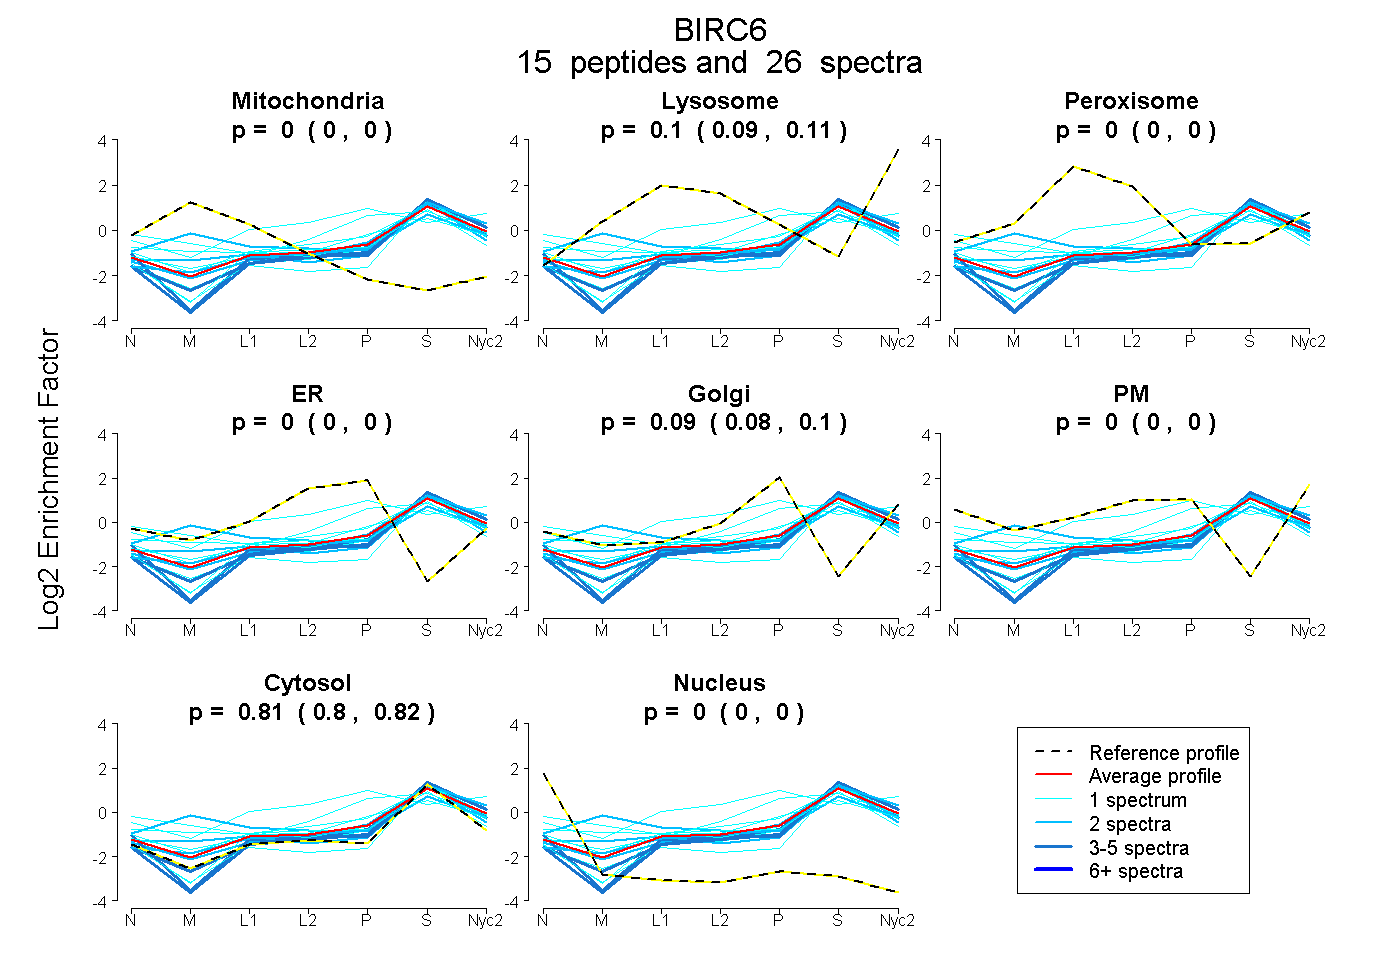
| Plot | Mito | Lyso | Perox | ER | Golgi | PM | Cytosol | Nucleus | |||||
| Expt A |
15 peptides |
26 spectra |
|
0.000 0.000 | 0.000 |
0.101 0.092 | 0.109 |
0.000 0.000 | 0.000 |
0.000 0.000 | 0.000 |
0.091 0.079 | 0.100 |
0.000 0.000 | 0.000 |
0.808 0.799 | 0.816 |
0.000 0.000 | 0.000 |
||
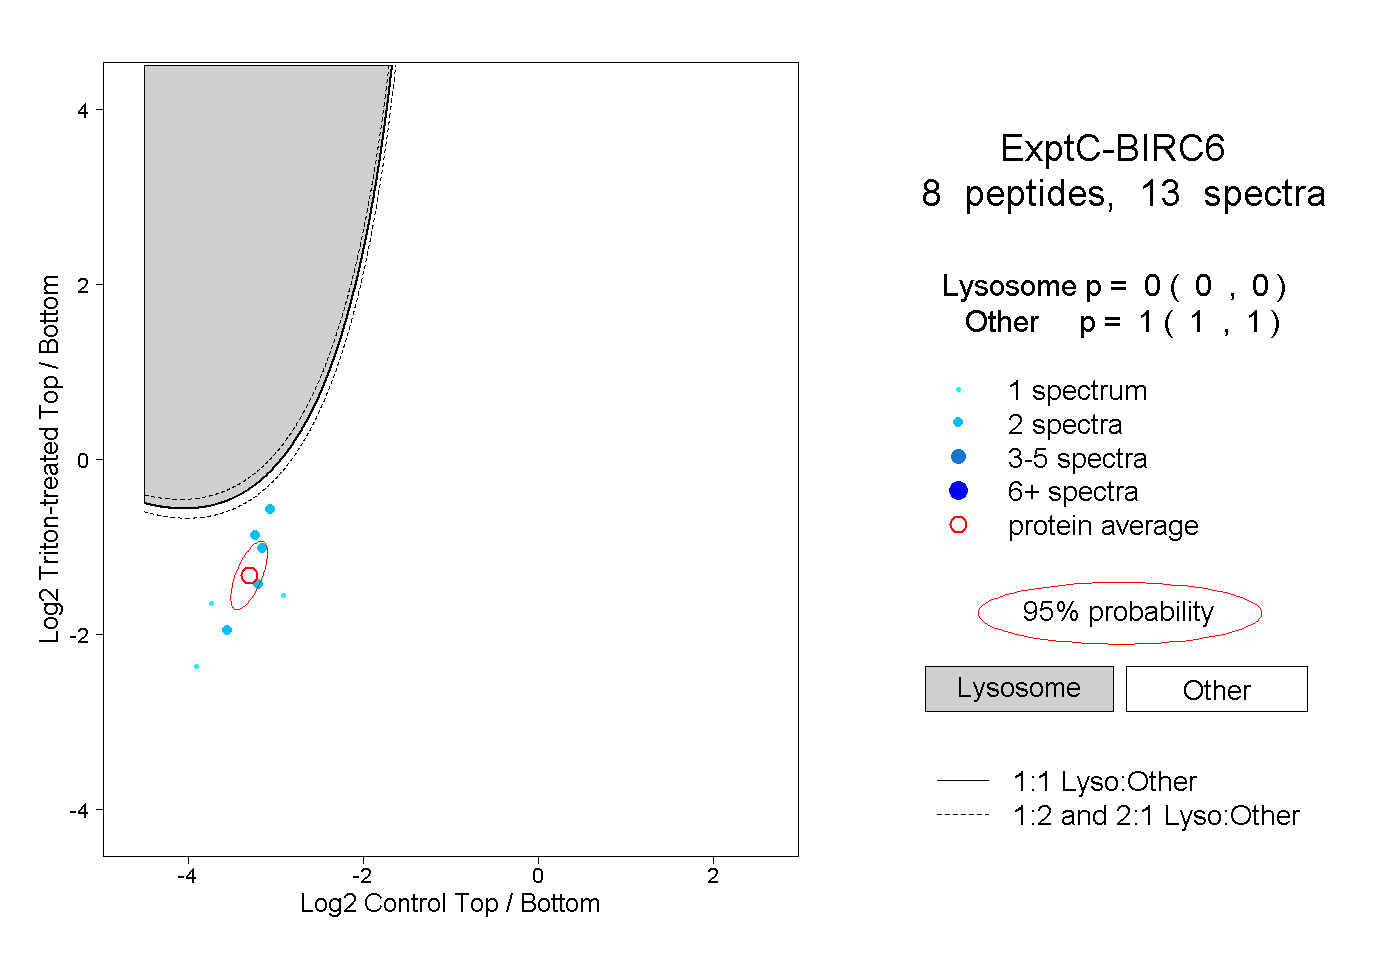
| Plot | Lyso | Other | |||||||||||
| Expt C |
8 peptides |
13 spectra |
|
0.000 0.000 | 0.000 |
1.000 1.000 | 1.000 |
| 2 spectra, VAIGASR | 0.000 | 1.000 | ||||||||
| 2 spectra, LTPLEALLQTR | 0.015 | 0.985 | ||||||||
| 1 spectrum, ESPEIEPLPFTLAHDR | 0.000 | 1.000 | ||||||||
| 1 spectrum, GAFQTGQGPLDAQVK | 0.000 | 1.000 | ||||||||
| 2 spectra, LLNTLCR | 0.000 | 1.000 | ||||||||
| 2 spectra, LIDILLR | 0.000 | 1.000 | ||||||||
| 2 spectra, VSDTPSITAK | 0.002 | 0.998 | ||||||||
| 1 spectrum, LSYLLPSARPELGVGPGR | 0.000 | 1.000 |