 4
4peptides
spectra
0.000 | 0.000
0.000 | 0.000
0.000 | 0.000
0.460 | 0.537
0.413 | 0.485
0.000 | 0.026
0.000 | 0.005
0.027 | 0.045
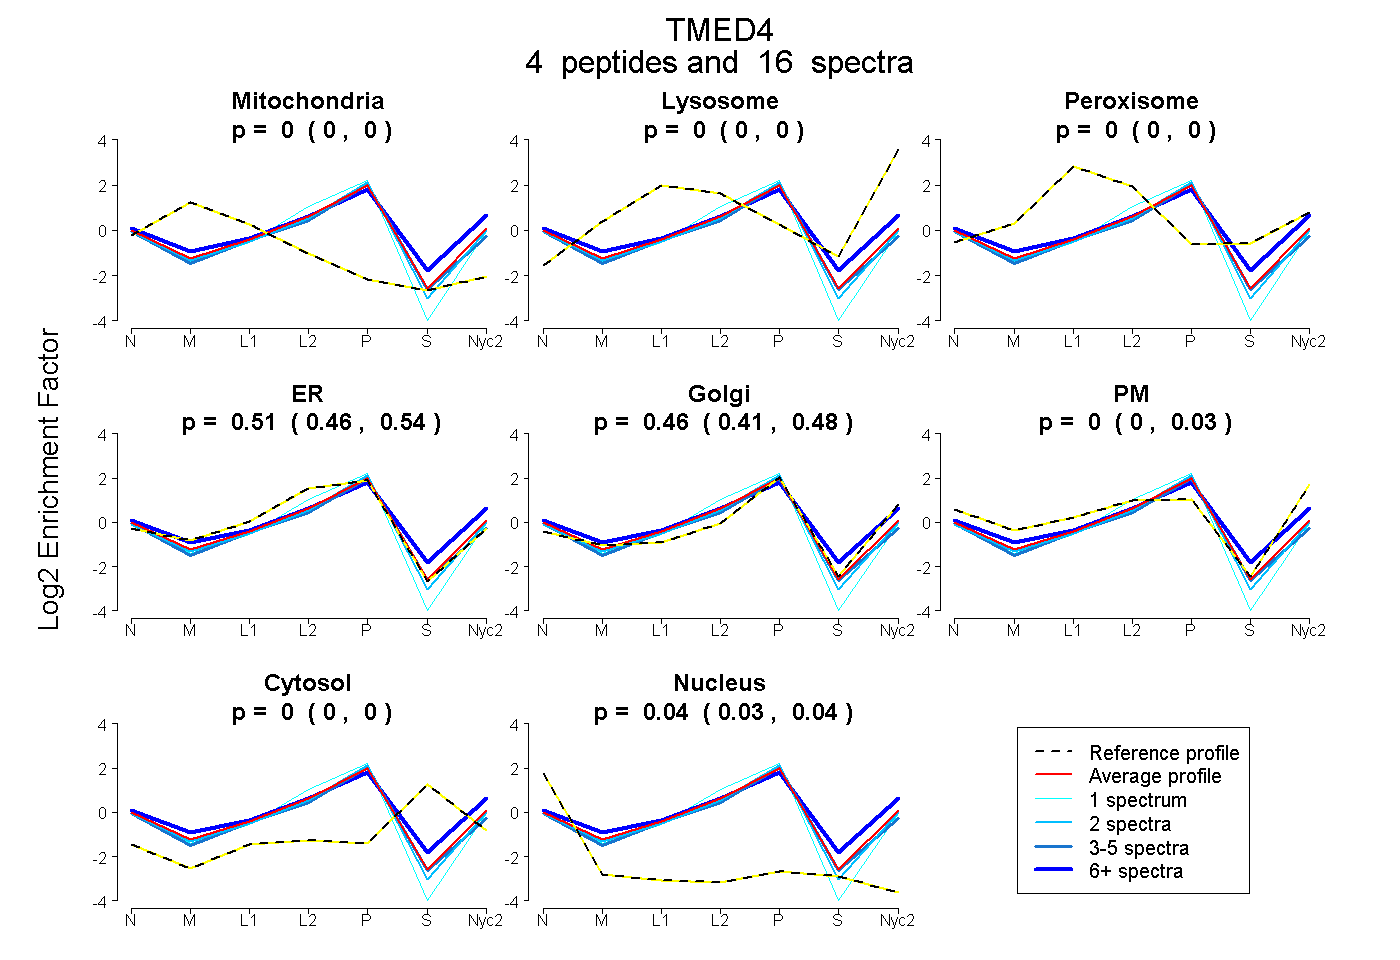
| Plot | Mito | Lyso | Perox | ER | Golgi | PM | Cytosol | Nucleus | |||||
| Expt A |
4 peptides |
16 spectra |
|
0.000 0.000 | 0.000 |
0.000 0.000 | 0.000 |
0.000 0.000 | 0.000 |
0.505 0.460 | 0.537 |
0.458 0.413 | 0.485 |
0.000 0.000 | 0.026 |
0.000 0.000 | 0.005 |
0.037 0.027 | 0.045 |
| 8 spectra, LTSESTNQR | 0.000 | 0.000 | 0.003 | 0.268 | 0.380 | 0.269 | 0.079 | 0.000 | ||
| 1 spectrum, LTELQLR | 0.000 | 0.000 | 0.000 | 0.703 | 0.264 | 0.000 | 0.000 | 0.033 | ||
| 2 spectra, QLLDQVEQIQK | 0.000 | 0.000 | 0.000 | 0.505 | 0.451 | 0.000 | 0.000 | 0.044 | ||
| 5 spectra, MALFAGGK | 0.000 | 0.000 | 0.000 | 0.523 | 0.398 | 0.000 | 0.000 | 0.078 |
| Plot | Mito | Lyso or Perox | ER | Golgi | PM | Cytosol | Nucleus | ||||||
| Expt B |
4 peptides |
6 spectra |
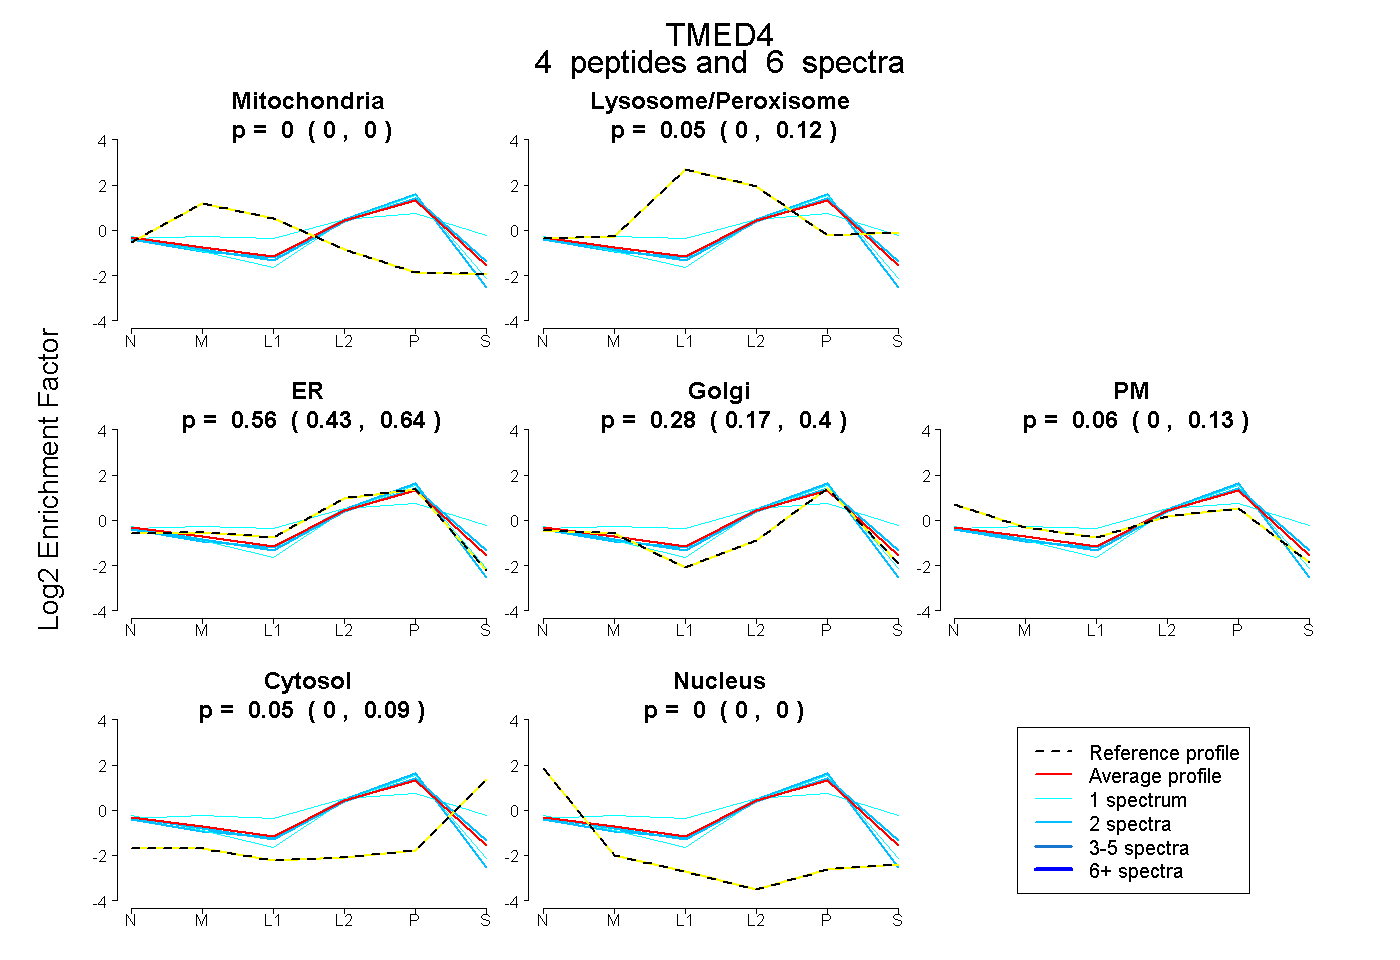 |
0.000 0.000 | 0.000 |
0.045 0.000 | 0.124 |
0.565 0.426 | 0.642 |
0.279 0.169 | 0.403 |
0.063 0.000 | 0.127 |
0.048 0.000 | 0.087 |
0.000 0.000 | 0.000 |
|||
| Plot | Lyso | Other | |||||||||||
| Expt C |
3 peptides |
13 spectra |
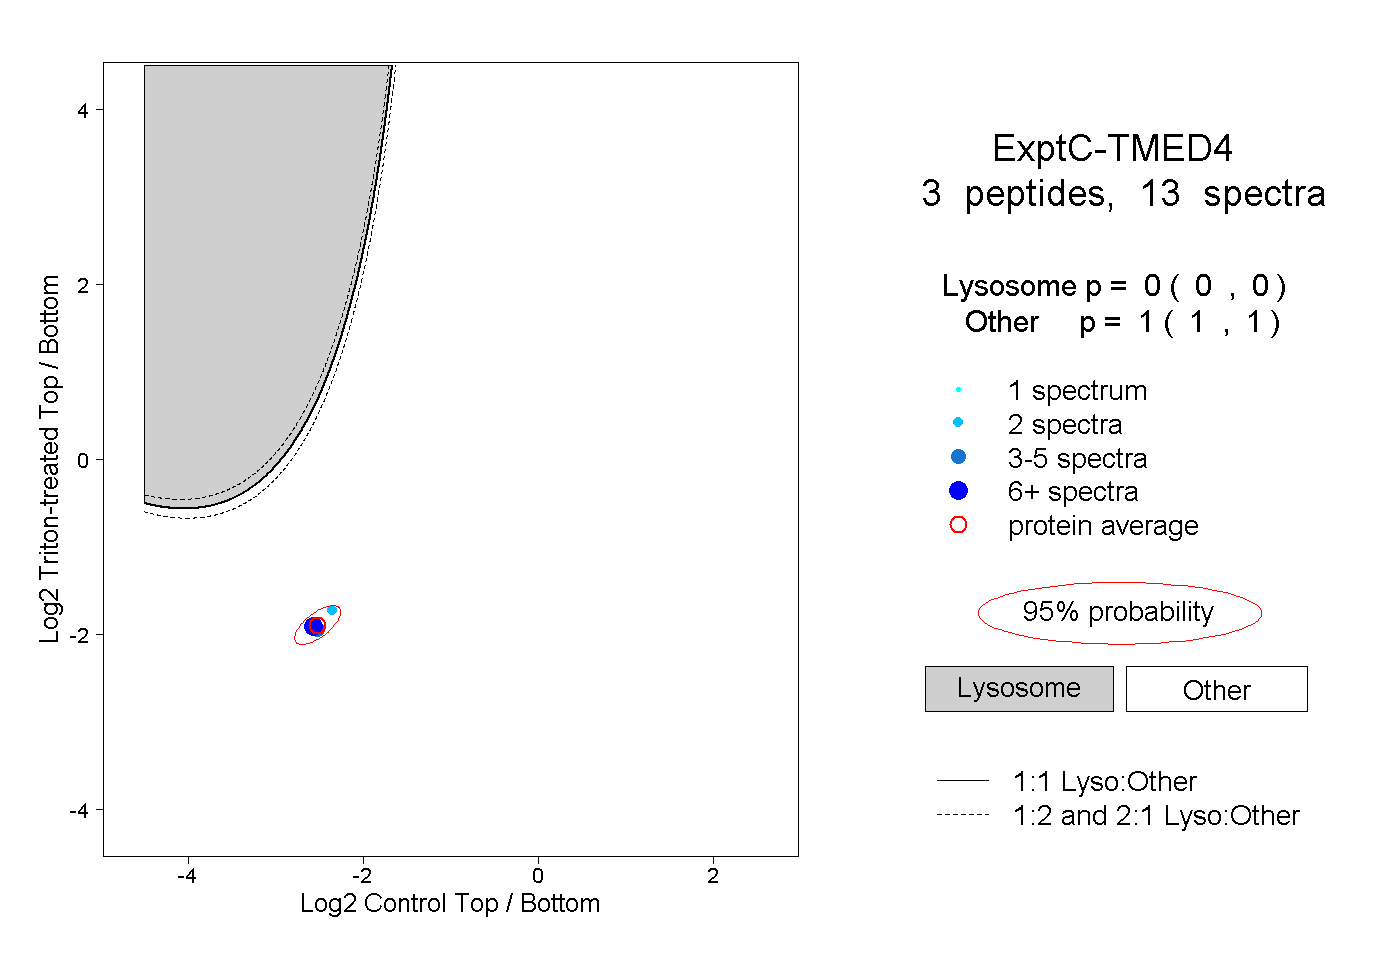 |
0.000 0.000 | 0.000 |
1.000 1.000 | 1.000 |
||||||||
| Plot | Lyso | Other | |||||||||||
| Expt D |
2 peptides |
3 spectra |
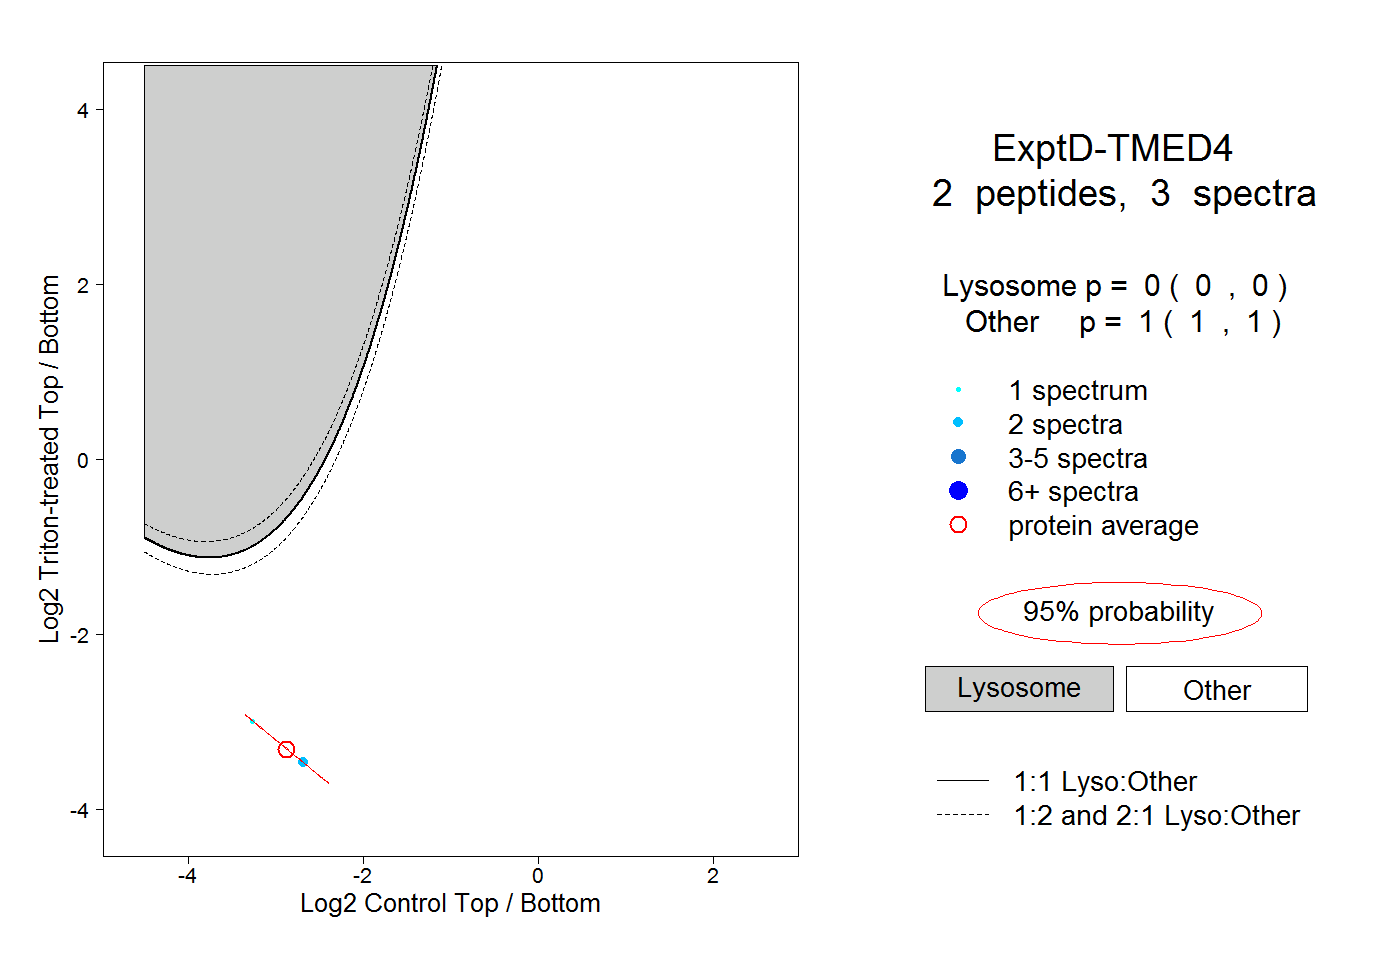 |
0.000 0.000 | 0.000 |
1.000 1.000 | 1.000 |