12
12peptides
spectra
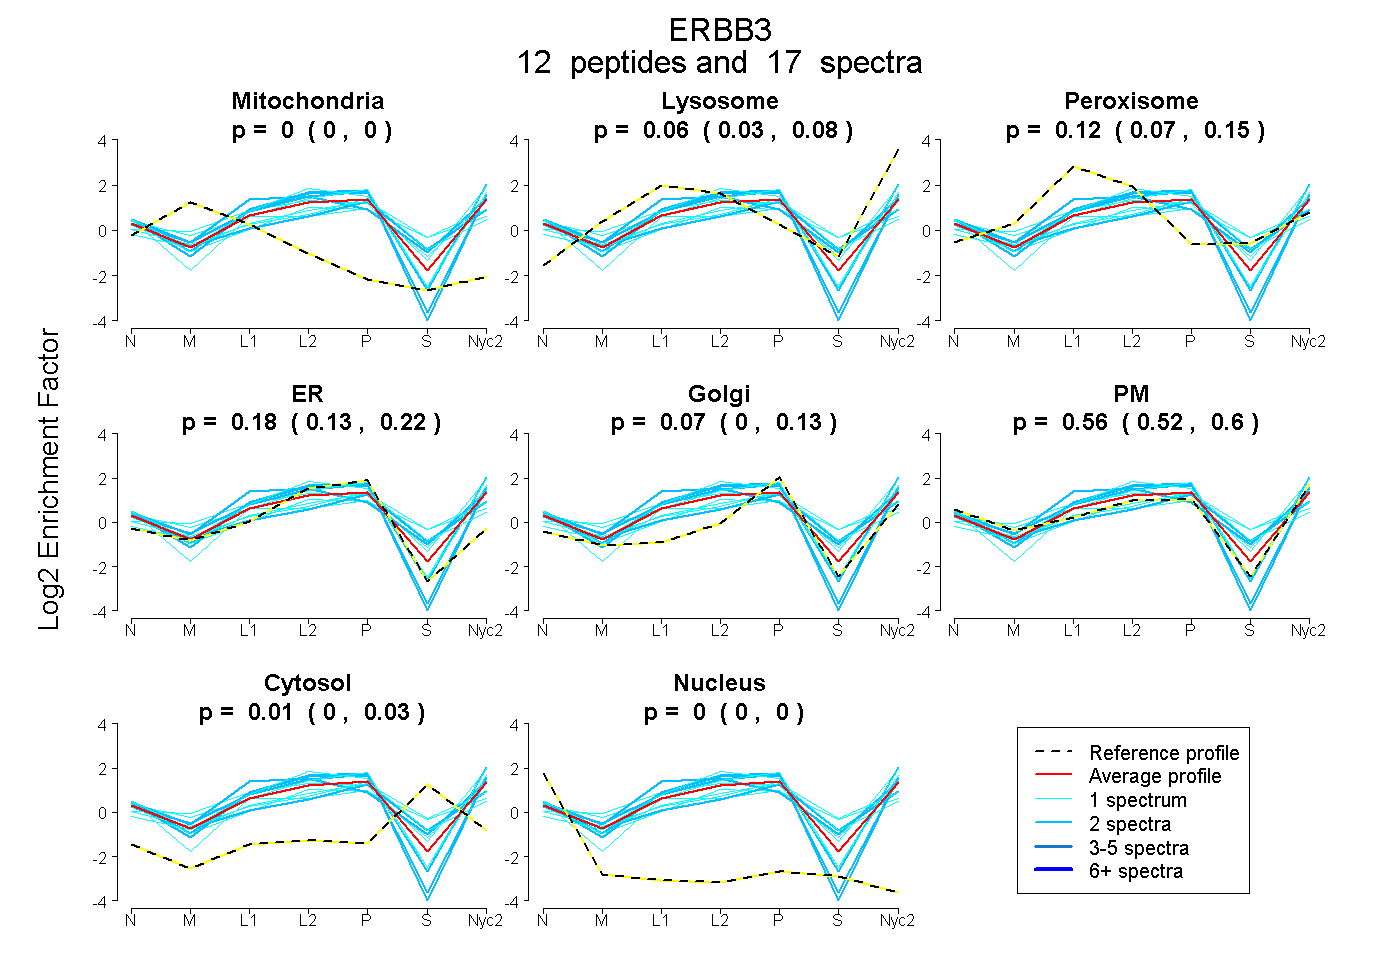
0.000 | 0.000
0.029 | 0.083
0.072 | 0.154
0.125 | 0.224
0.000 | 0.132
0.521 | 0.596
0.000 | 0.034
0.000 | 0.000
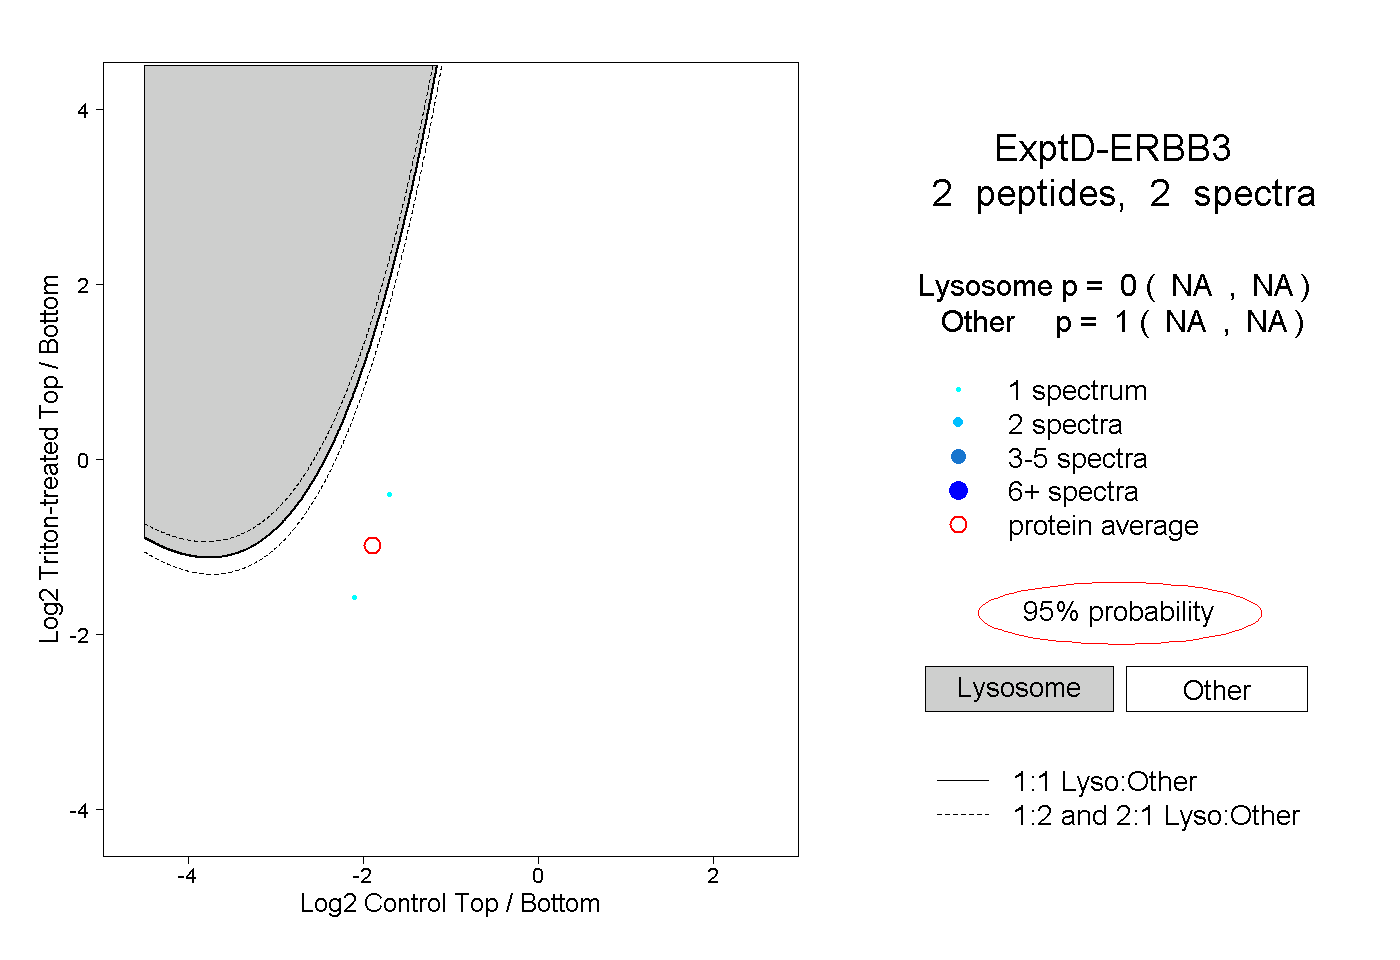
1peptide
spectra
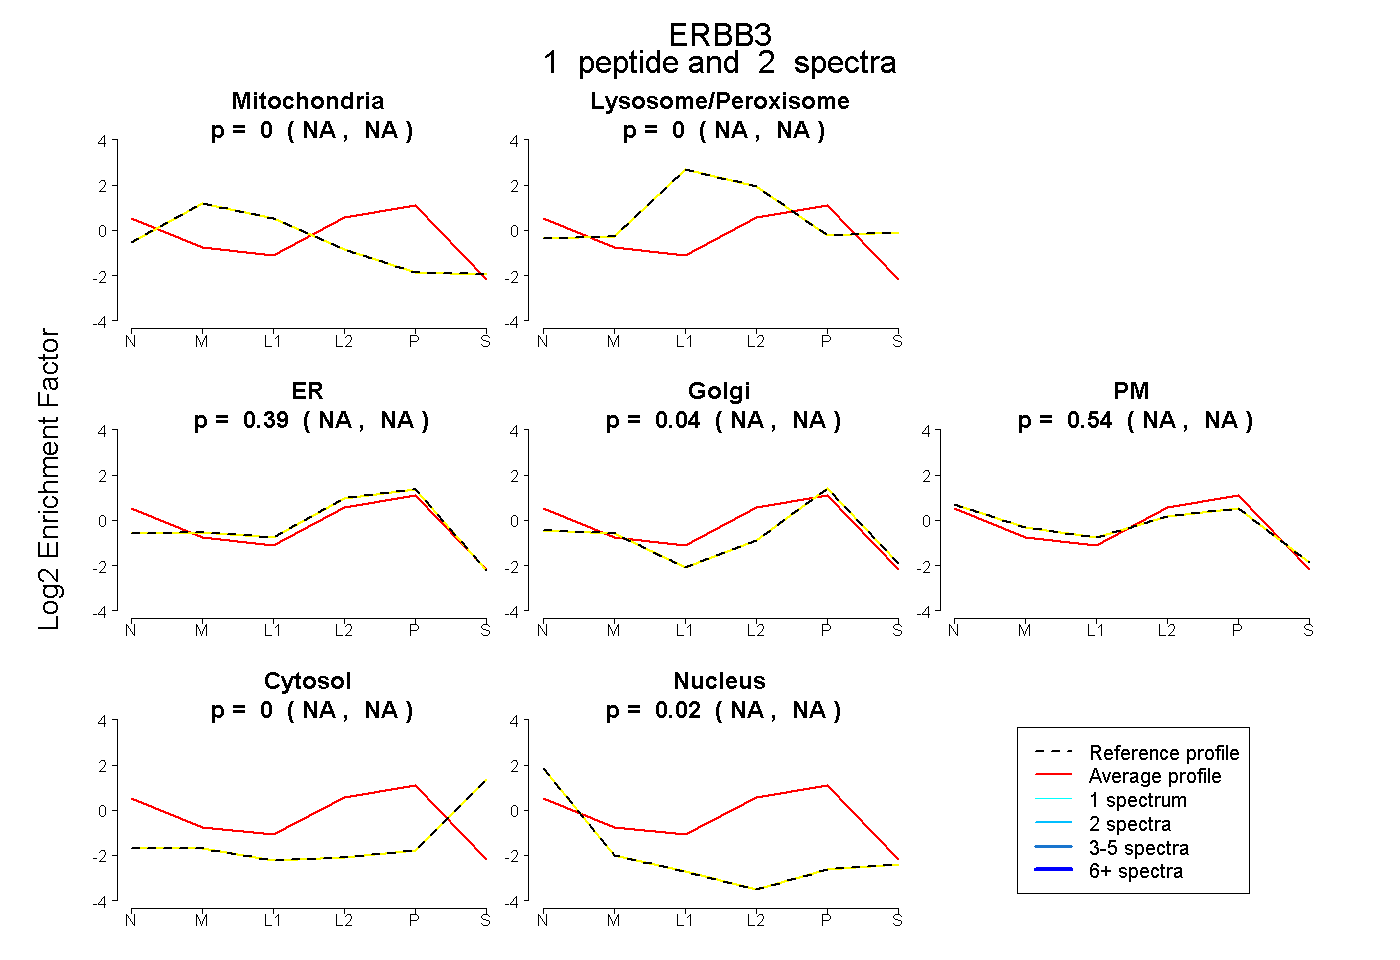
NA | NA
NA | NA
NA | NA
NA | NA
NA | NA
NA | NA
NA | NA
12peptides
spectra
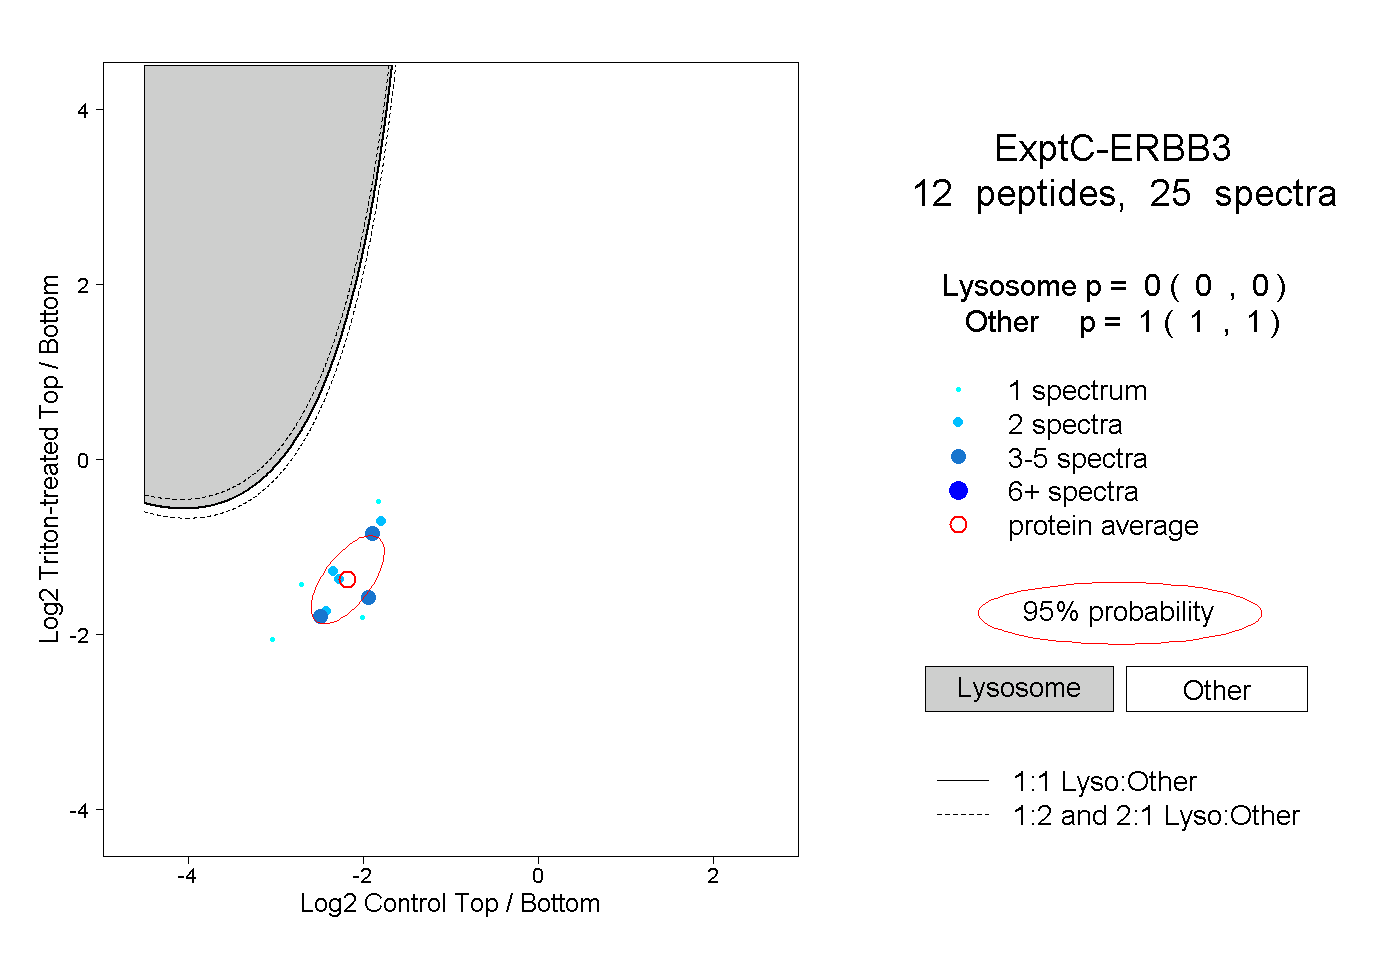
0.000 | 0.000
1.000 | 1.000