 12
12peptides
spectra
0.000 | 0.000
0.029 | 0.083
0.072 | 0.154
0.125 | 0.224
0.000 | 0.132
0.521 | 0.596
0.000 | 0.034
0.000 | 0.000
| Plot | Mito | Lyso | Perox | ER | Golgi | PM | Cytosol | Nucleus | |||||
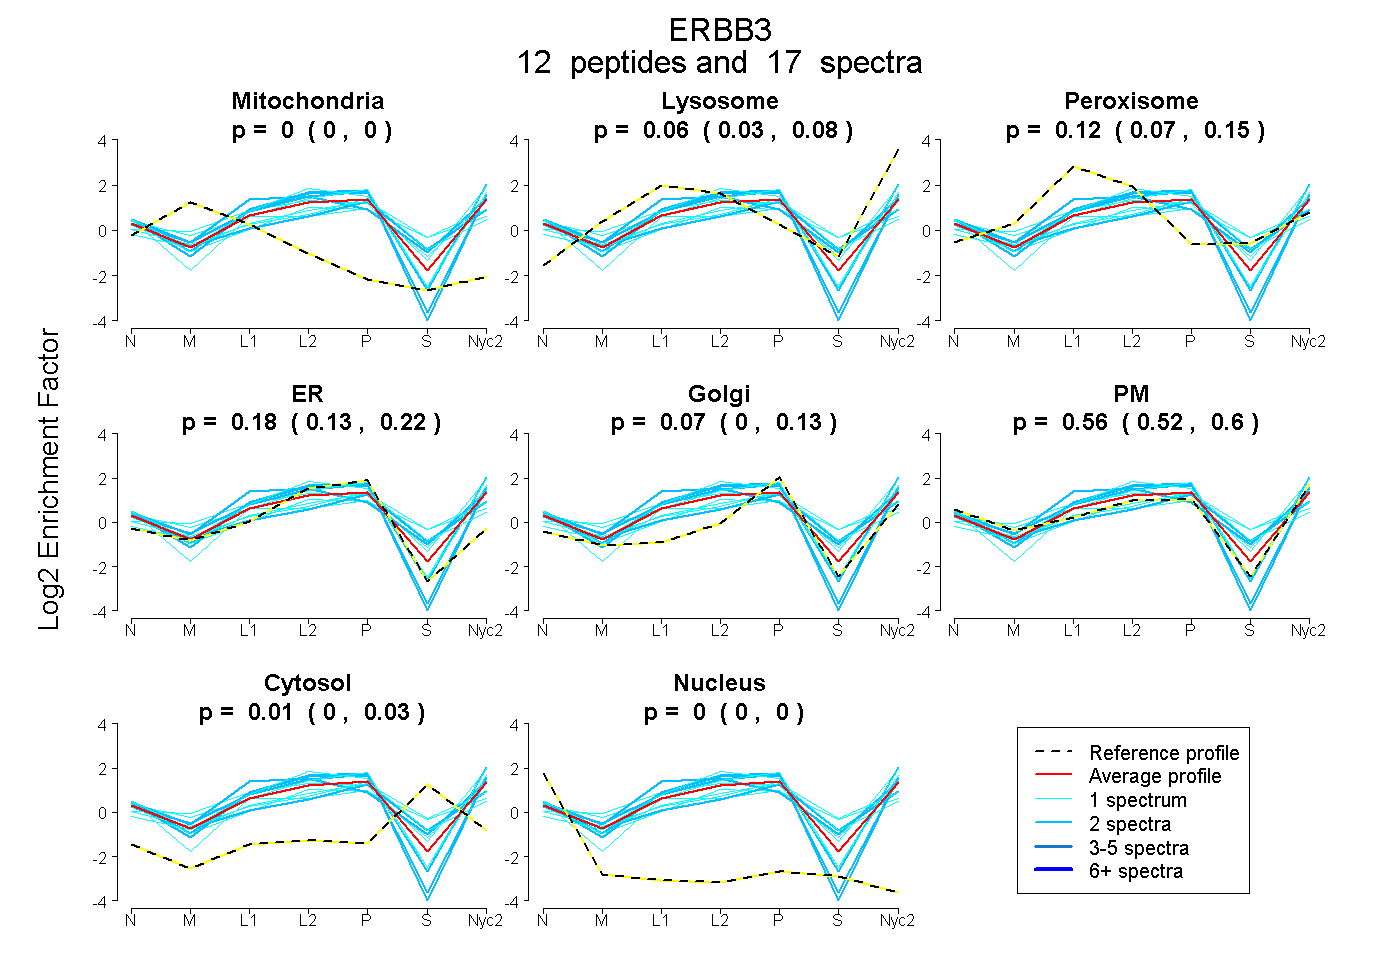
| Expt A |
12 peptides |
17 spectra |
|
0.000 0.000 | 0.000 |
0.058 0.029 | 0.083 |
0.116 0.072 | 0.154 |
0.178 0.125 | 0.224 |
0.072 0.000 | 0.132 |
0.562 0.521 | 0.596 |
0.014 0.000 | 0.034 |
0.000 0.000 | 0.000 |
| 2 spectra, ACEGTGSGSR | 0.000 | 0.000 | 0.000 | 0.302 | 0.000 | 0.698 | 0.000 | 0.000 | ||
| 2 spectra, QLLHSEAK | 0.000 | 0.000 | 0.165 | 0.000 | 0.275 | 0.408 | 0.153 | 0.000 | ||
| 1 spectrum, CPEPLVYNK | 0.000 | 0.000 | 0.153 | 0.170 | 0.000 | 0.415 | 0.261 | 0.000 | ||
| 1 spectrum, GAEIVVK | 0.000 | 0.245 | 0.146 | 0.020 | 0.097 | 0.491 | 0.000 | 0.000 | ||
| 2 spectra, GTQVYDGK | 0.000 | 0.000 | 0.406 | 0.012 | 0.000 | 0.562 | 0.021 | 0.000 | ||
| 2 spectra, GESIEPLDPSEK | 0.000 | 0.108 | 0.000 | 0.154 | 0.000 | 0.738 | 0.000 | 0.000 | ||
| 1 spectrum, WMALESIHFGK | 0.000 | 0.085 | 0.265 | 0.050 | 0.362 | 0.075 | 0.163 | 0.000 | ||
| 2 spectra, GFSLLIMK | 0.000 | 0.026 | 0.000 | 0.280 | 0.000 | 0.694 | 0.000 | 0.000 | ||
| 1 spectrum, VLGSGVFGTVHK | 0.000 | 0.148 | 0.000 | 0.163 | 0.000 | 0.689 | 0.000 | 0.000 | ||
| 1 spectrum, ASGPGTPPAAEPSVLTTK | 0.000 | 0.009 | 0.222 | 0.000 | 0.114 | 0.568 | 0.087 | 0.000 | ||
| 1 spectrum, LAEIPDLLEK | 0.000 | 0.014 | 0.000 | 0.267 | 0.000 | 0.718 | 0.000 | 0.000 | ||
| 1 spectrum, SLEATDSAFDNPDYWHSR | 0.000 | 0.000 | 0.277 | 0.140 | 0.405 | 0.069 | 0.109 | 0.000 |
| Plot | Mito | Lyso or Perox | ER | Golgi | PM | Cytosol | Nucleus | ||||||
| Expt B |
1 peptide |
2 spectra |
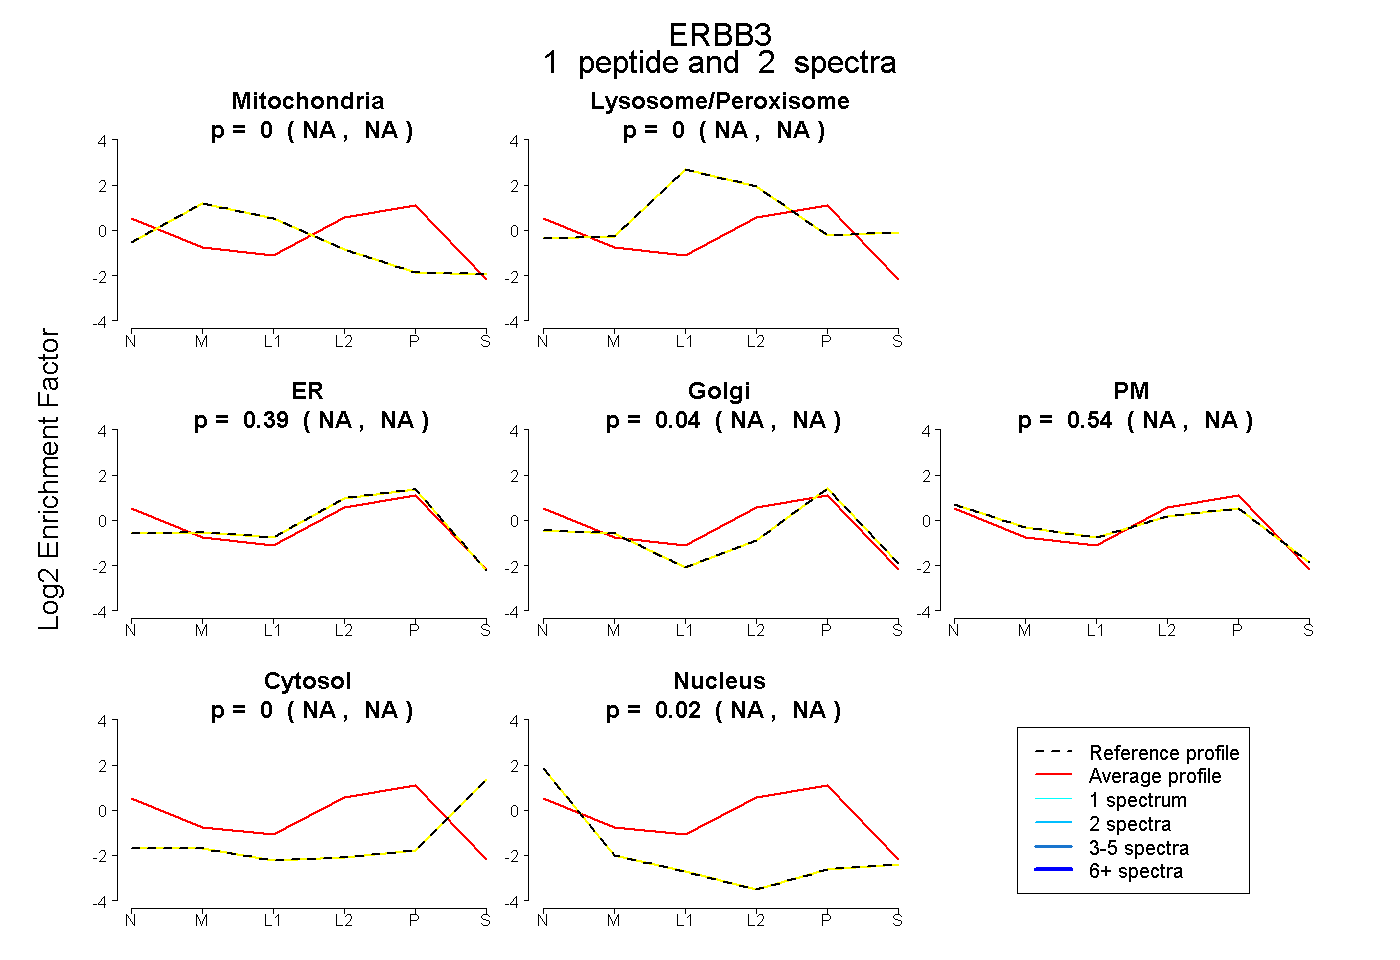 |
0.000 NA | NA |
0.000 NA | NA |
0.393 NA | NA |
0.044 NA | NA |
0.544 NA | NA |
0.000 NA | NA |
0.018 NA | NA |
|||
| Plot | Lyso | Other | |||||||||||
| Expt C |
12 peptides |
25 spectra |
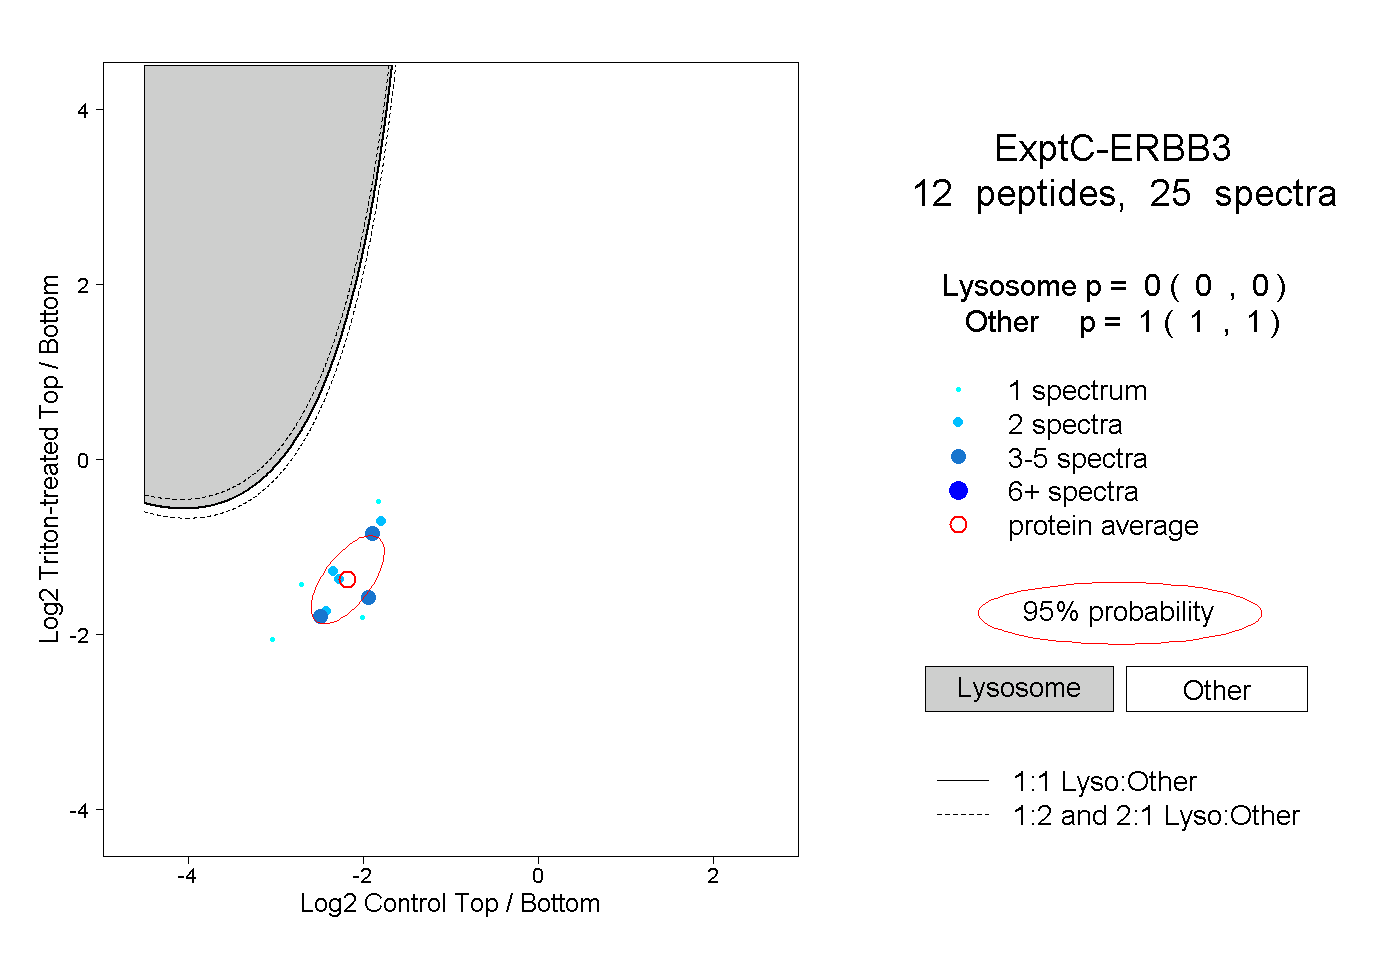 |
0.000 0.000 | 0.000 |
1.000 1.000 | 1.000 |
||||||||
| Plot | Lyso | Other | |||||||||||
| Expt D |
2 peptides |
2 spectra |
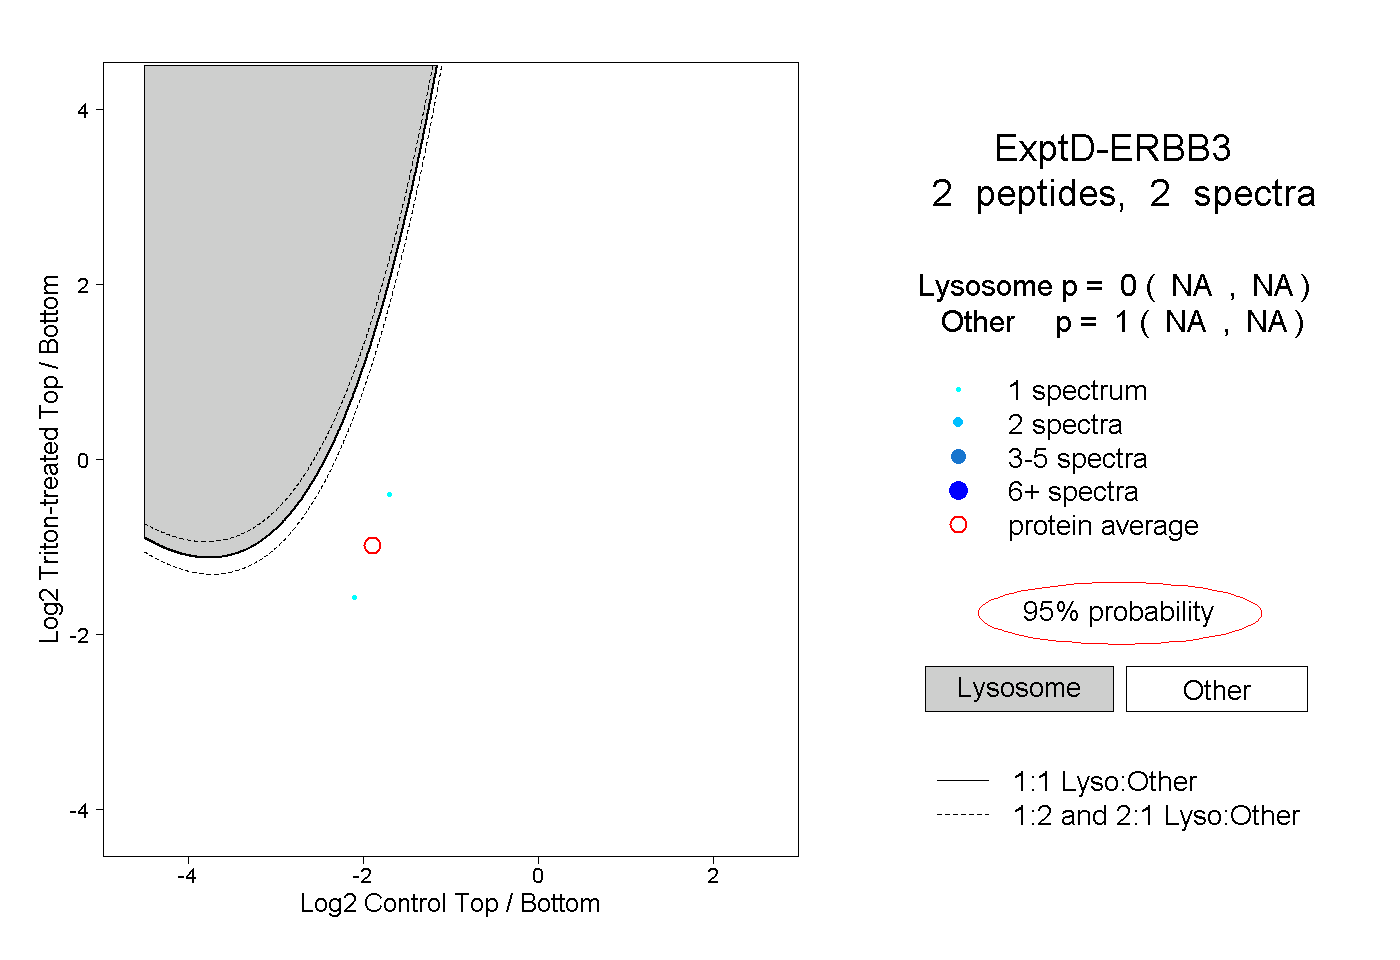 |
0.000 NA | NA |
1.000 NA | NA |