 8
8peptides
spectra
0.000 | 0.000
0.000 | 0.000
0.000 | 0.000
0.000 | 0.036
0.042 | 0.139
0.244 | 0.337
0.584 | 0.617
0.000 | 0.000
| Plot | Mito | Lyso | Perox | ER | Golgi | PM | Cytosol | Nucleus | |||||
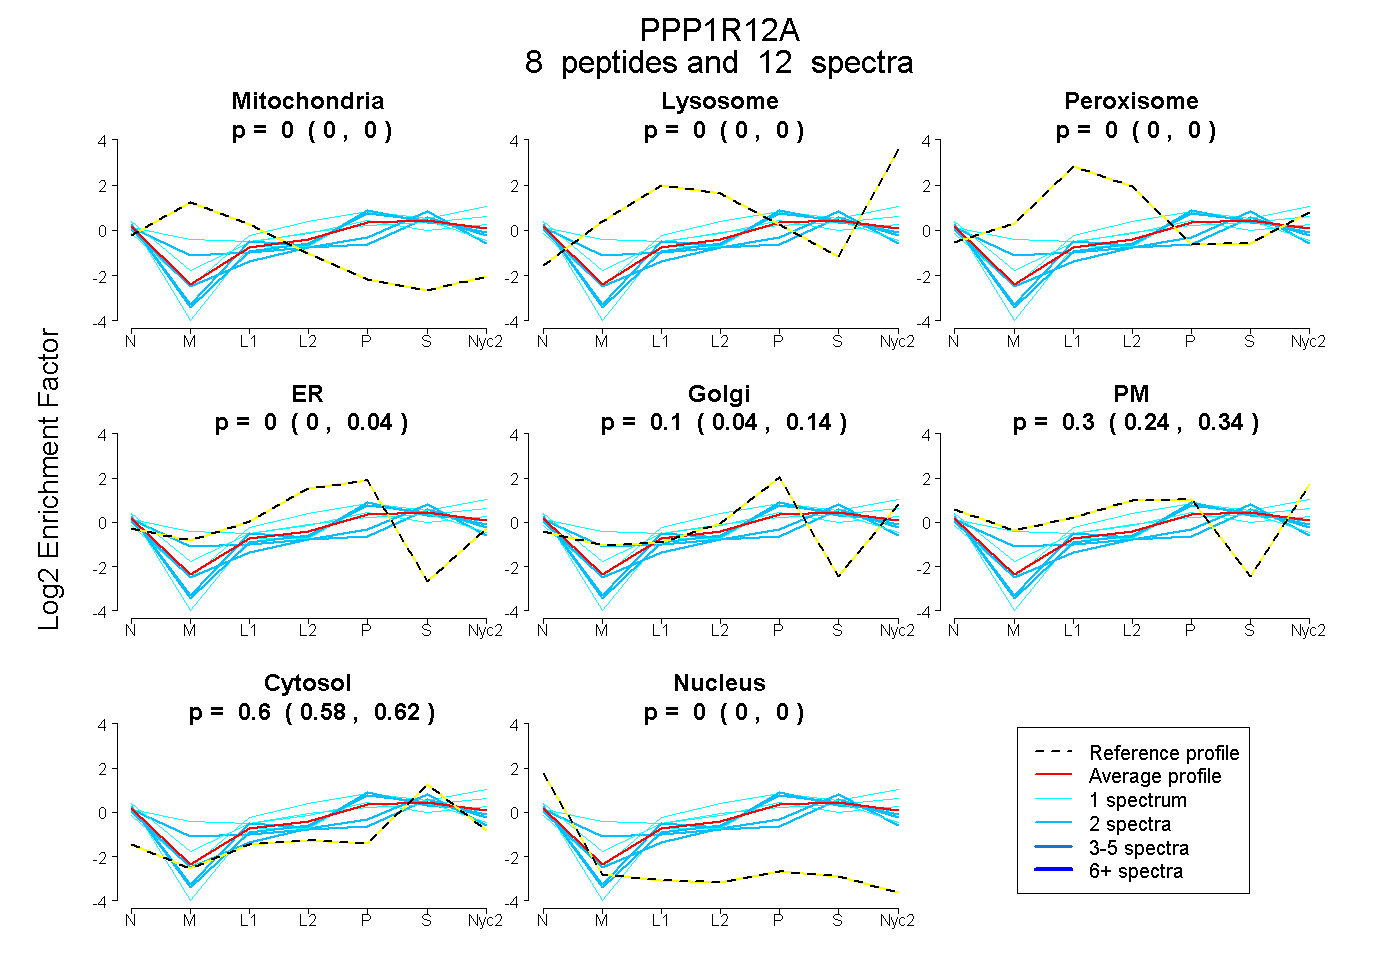
| Expt A |
8 peptides |
12 spectra |
|
0.000 0.000 | 0.000 |
0.000 0.000 | 0.000 |
0.000 0.000 | 0.000 |
0.000 0.000 | 0.036 |
0.100 0.042 | 0.139 |
0.298 0.244 | 0.337 |
0.602 0.584 | 0.617 |
0.000 0.000 | 0.000 |
| 2 spectra, TYDETYAR | 0.000 | 0.000 | 0.000 | 0.014 | 0.367 | 0.015 | 0.605 | 0.000 | ||
| 1 spectrum, ISEMEEELK | 0.000 | 0.000 | 0.005 | 0.000 | 0.000 | 0.474 | 0.520 | 0.000 | ||
| 1 spectrum, LWAEDSTEK | 0.021 | 0.000 | 0.095 | 0.000 | 0.077 | 0.402 | 0.405 | 0.000 | ||
| 2 spectra, GYTEVLK | 0.061 | 0.000 | 0.017 | 0.000 | 0.000 | 0.277 | 0.626 | 0.019 | ||
| 1 spectrum, TPPGSSPAGTQSSTSNR | 0.000 | 0.000 | 0.000 | 0.081 | 0.266 | 0.000 | 0.620 | 0.033 | ||
| 1 spectrum, LAYVAPTIPR | 0.000 | 0.124 | 0.000 | 0.015 | 0.064 | 0.314 | 0.483 | 0.000 | ||
| 2 spectra, SASYSYLEER | 0.000 | 0.000 | 0.000 | 0.000 | 0.338 | 0.099 | 0.563 | 0.000 | ||
| 2 spectra, QGVDIEAAR | 0.000 | 0.000 | 0.000 | 0.030 | 0.029 | 0.159 | 0.728 | 0.054 |
| Plot | Mito | Lyso or Perox | ER | Golgi | PM | Cytosol | Nucleus | ||||||
| Expt B |
1 peptide |
1 spectrum |
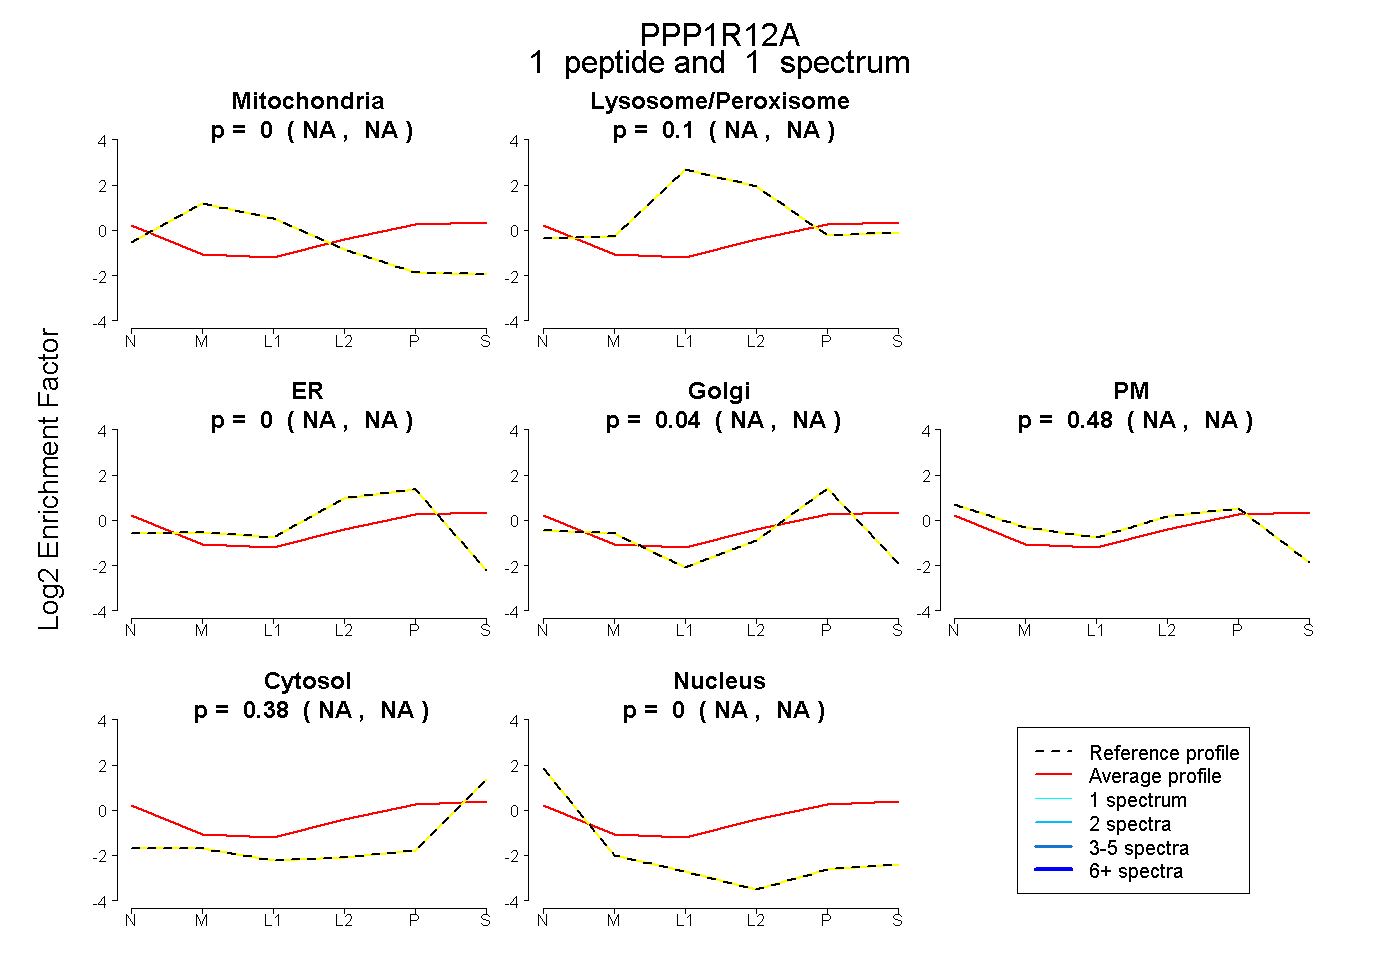 |
0.000 NA | NA |
0.104 NA | NA |
0.000 NA | NA |
0.039 NA | NA |
0.475 NA | NA |
0.382 NA | NA |
0.000 NA | NA |
|||
| Plot | Lyso | Other | |||||||||||
| Expt C |
6 peptides |
17 spectra |
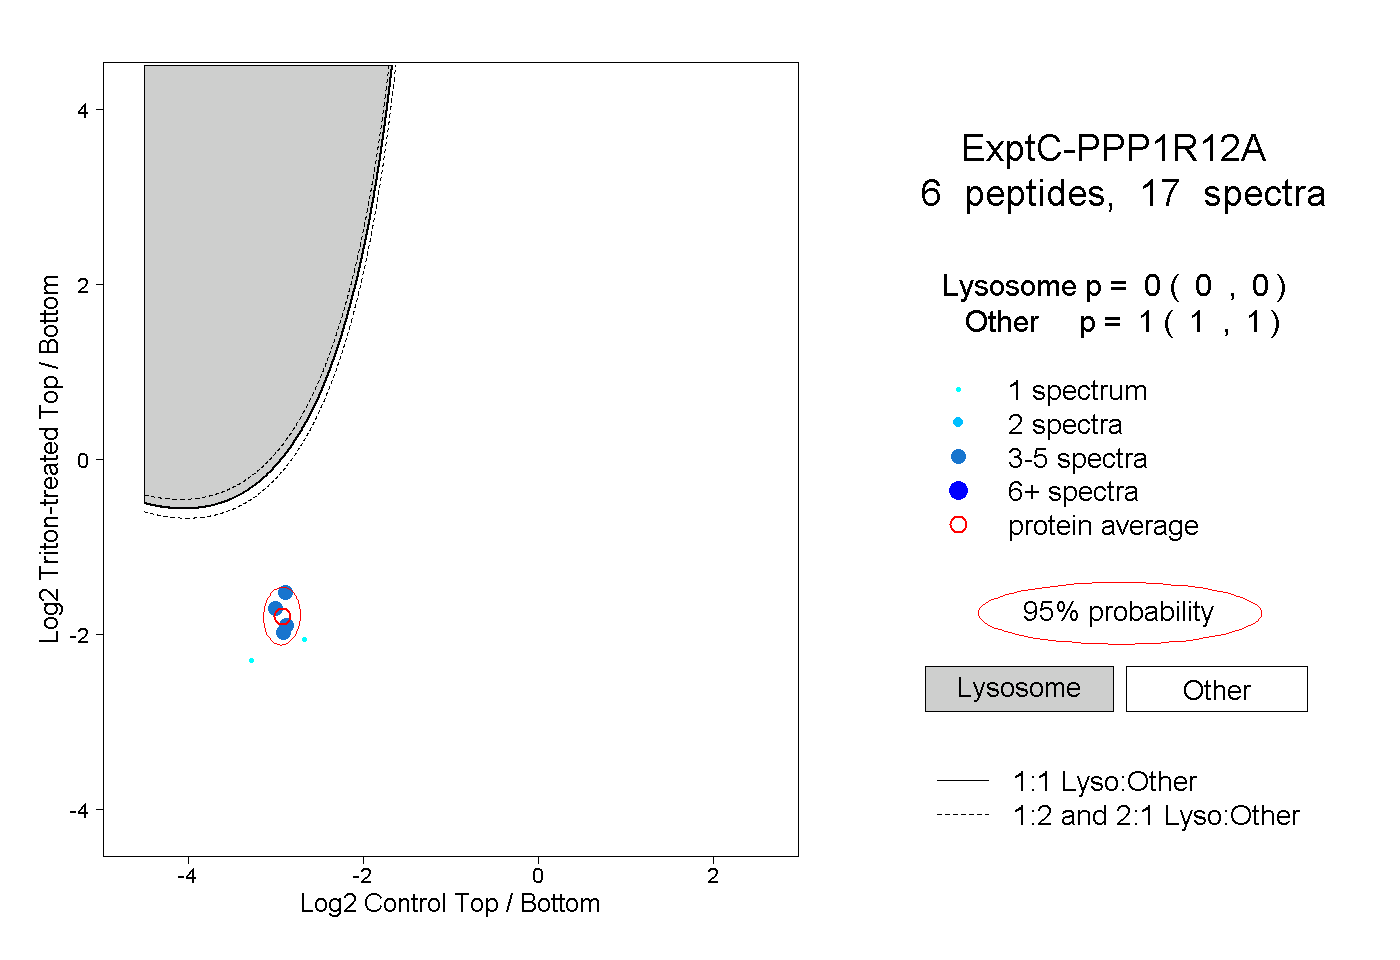 |
0.000 0.000 | 0.000 |
1.000 1.000 | 1.000 |
||||||||
| Plot | Lyso | Other | |||||||||||
| Expt D |
1 peptide |
1 spectrum |
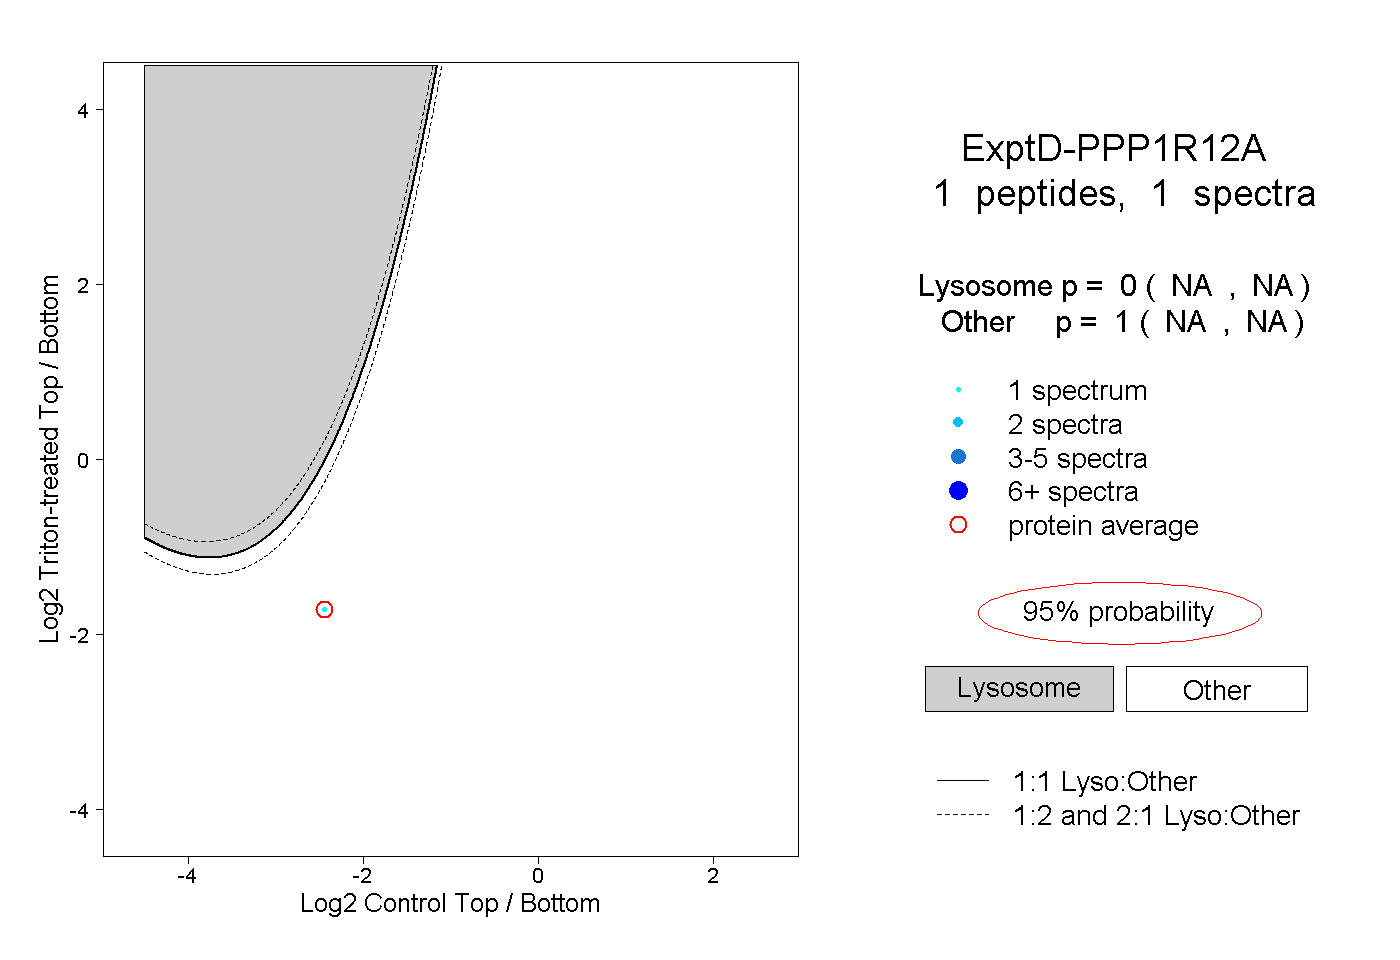 |
0.000 NA | NA |
1.000 NA | NA |