 4
4peptides
spectra
0.000 | 0.000
0.000 | 0.000
0.000 | 0.000
0.385 | 0.477
0.047 | 0.149
0.000 | 0.000
0.447 | 0.461
0.000 | 0.017
7peptides
spectra
0.000 | 0.000
1.000 | 1.000
| Plot | Mito | Lyso | Perox | ER | Golgi | PM | Cytosol | Nucleus | |||||
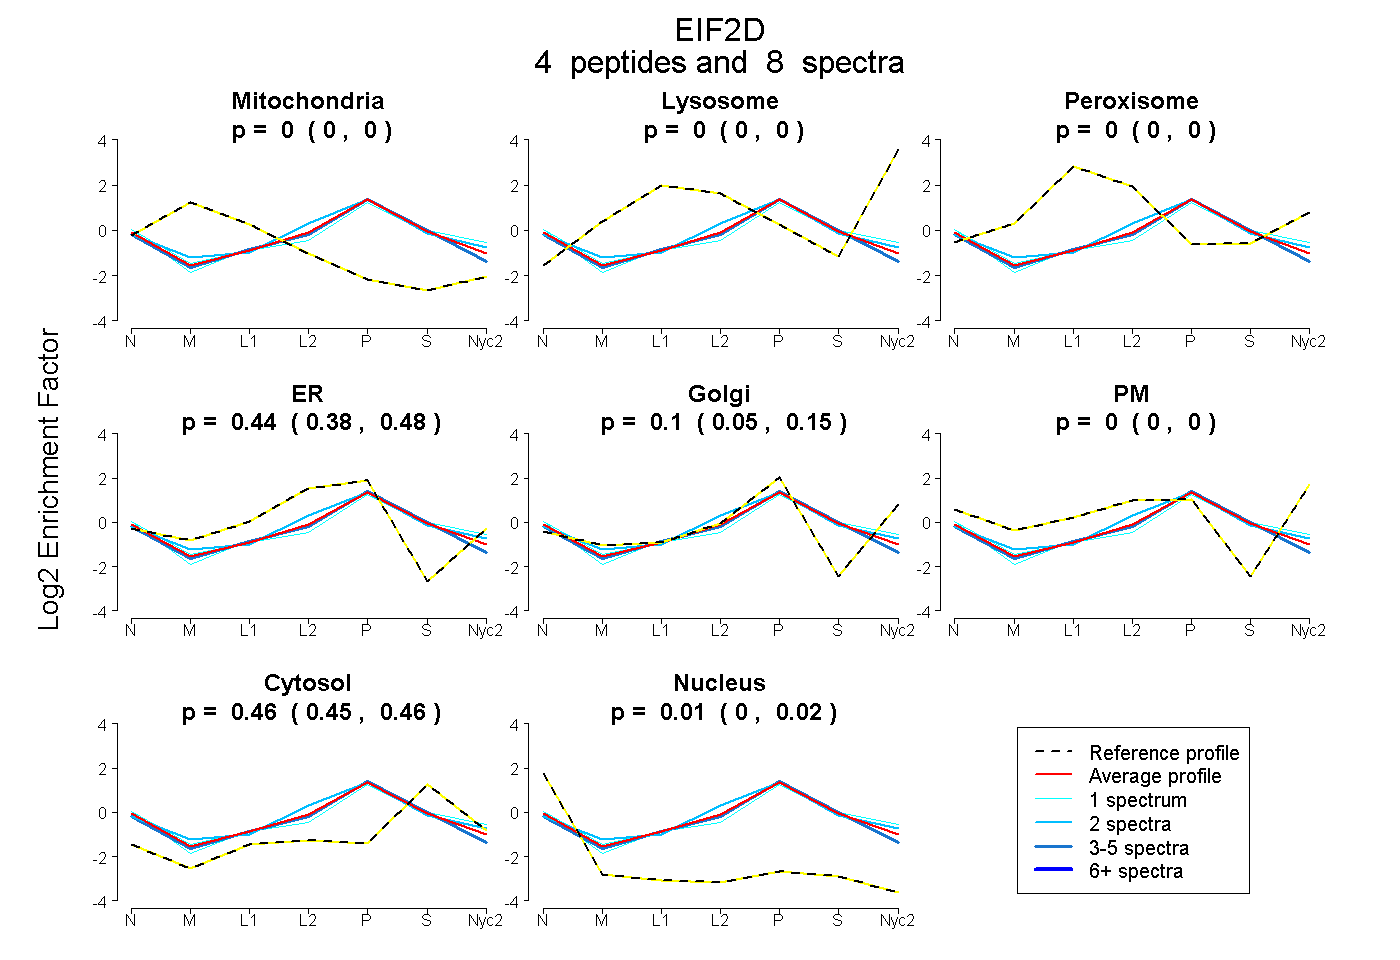
| Expt A |
4 peptides |
8 spectra |
|
0.000 0.000 | 0.000 |
0.000 0.000 | 0.000 |
0.000 0.000 | 0.000 |
0.436 0.385 | 0.477 |
0.103 0.047 | 0.149 |
0.000 0.000 | 0.000 |
0.455 0.447 | 0.461 |
0.006 0.000 | 0.017 |
||
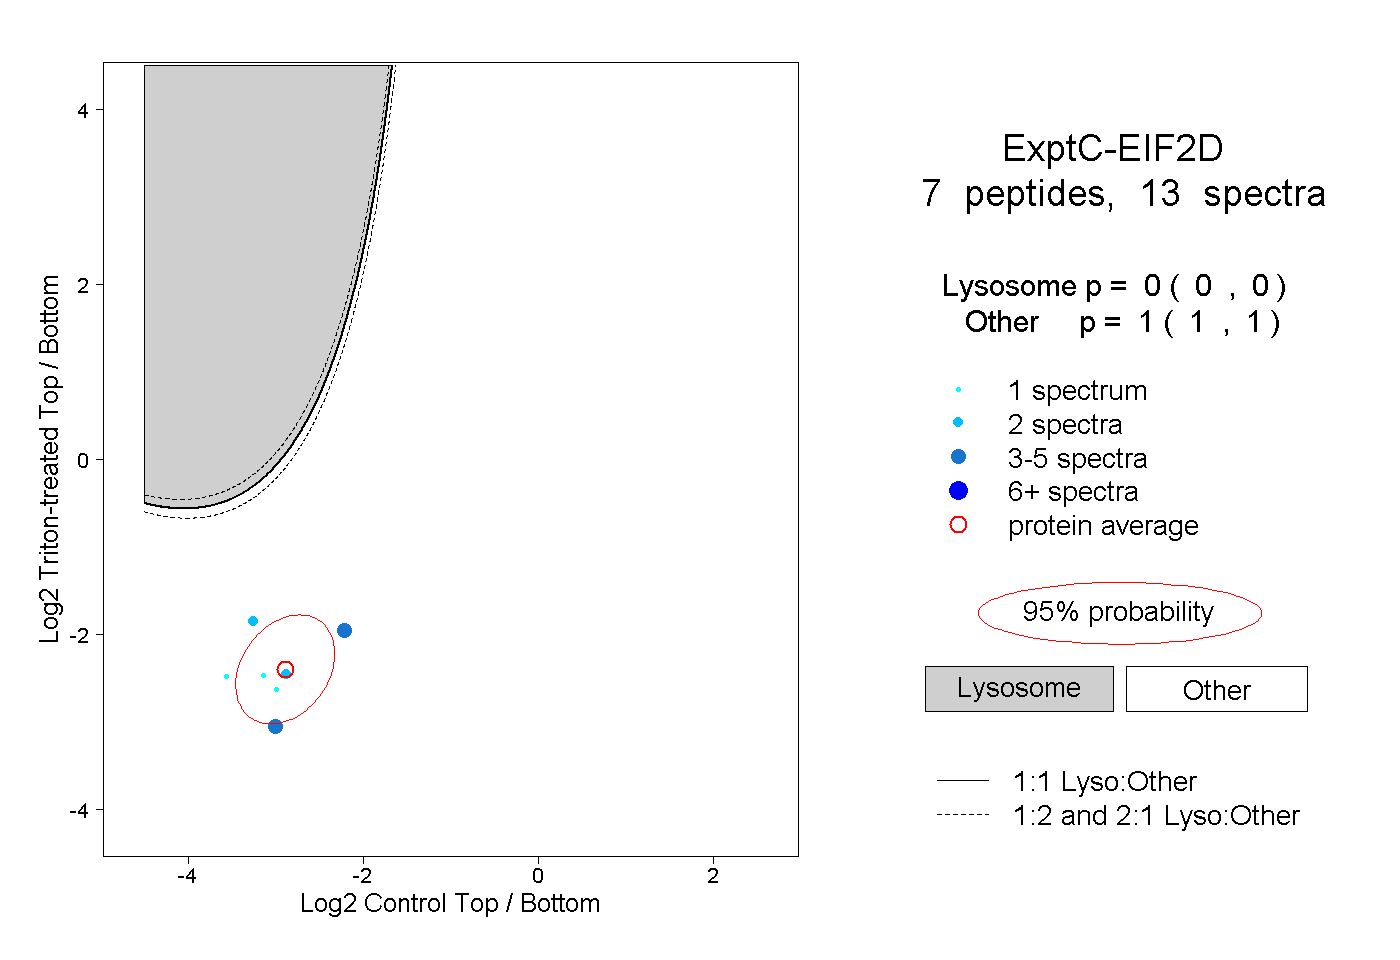
| Plot | Lyso | Other | |||||||||||
| Expt C |
7 peptides |
13 spectra |
|
0.000 0.000 | 0.000 |
1.000 1.000 | 1.000 |