RGD1560194
[ENSRNOP00000006754]
Main page
| | | Plot |
Mito |
Lyso |
|
Perox |
ER |
Golgi |
PM |
Cytosol |
Nucleus |
|
| Expt A |
 14
14
peptides |
176
spectra |
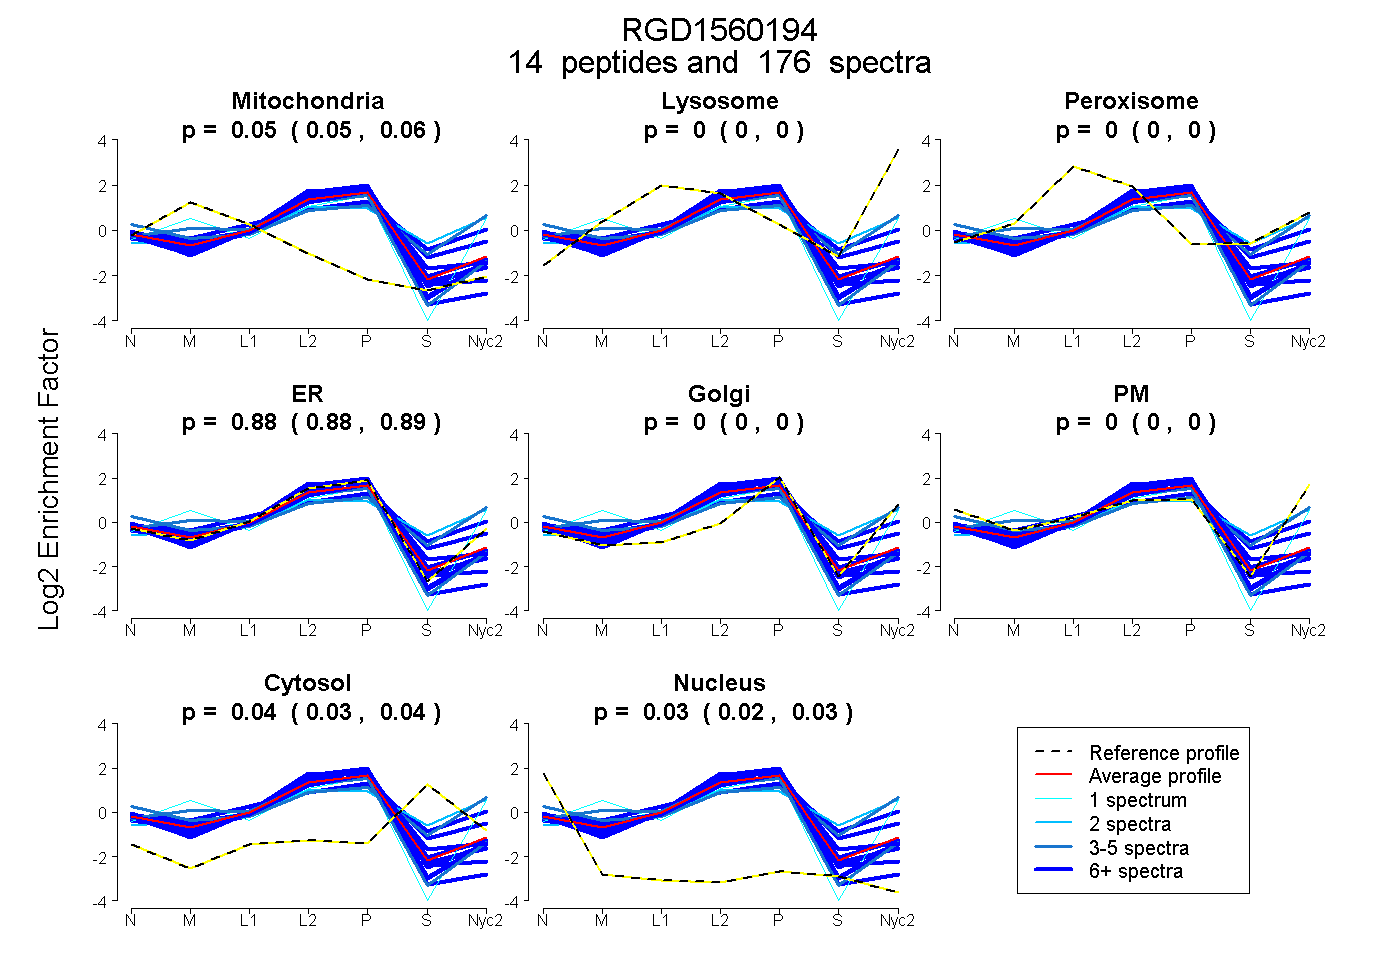 |
0.055
0.051 | 0.058 |
0.000
0.000 | 0.000 |
|
0.000
0.000 | 0.000 |
0.883
0.879 | 0.886 |
0.000
0.000 | 0.000 |
0.000
0.000 | 0.000 |
0.036
0.030 | 0.041 |
0.026
0.023 | 0.030 |
|
| | | Plot |
Mito |
|
Lyso or Perox |
|
ER |
Golgi |
PM |
Cytosol |
Nucleus |
|
| Expt B |
12
peptides |
63
spectra |
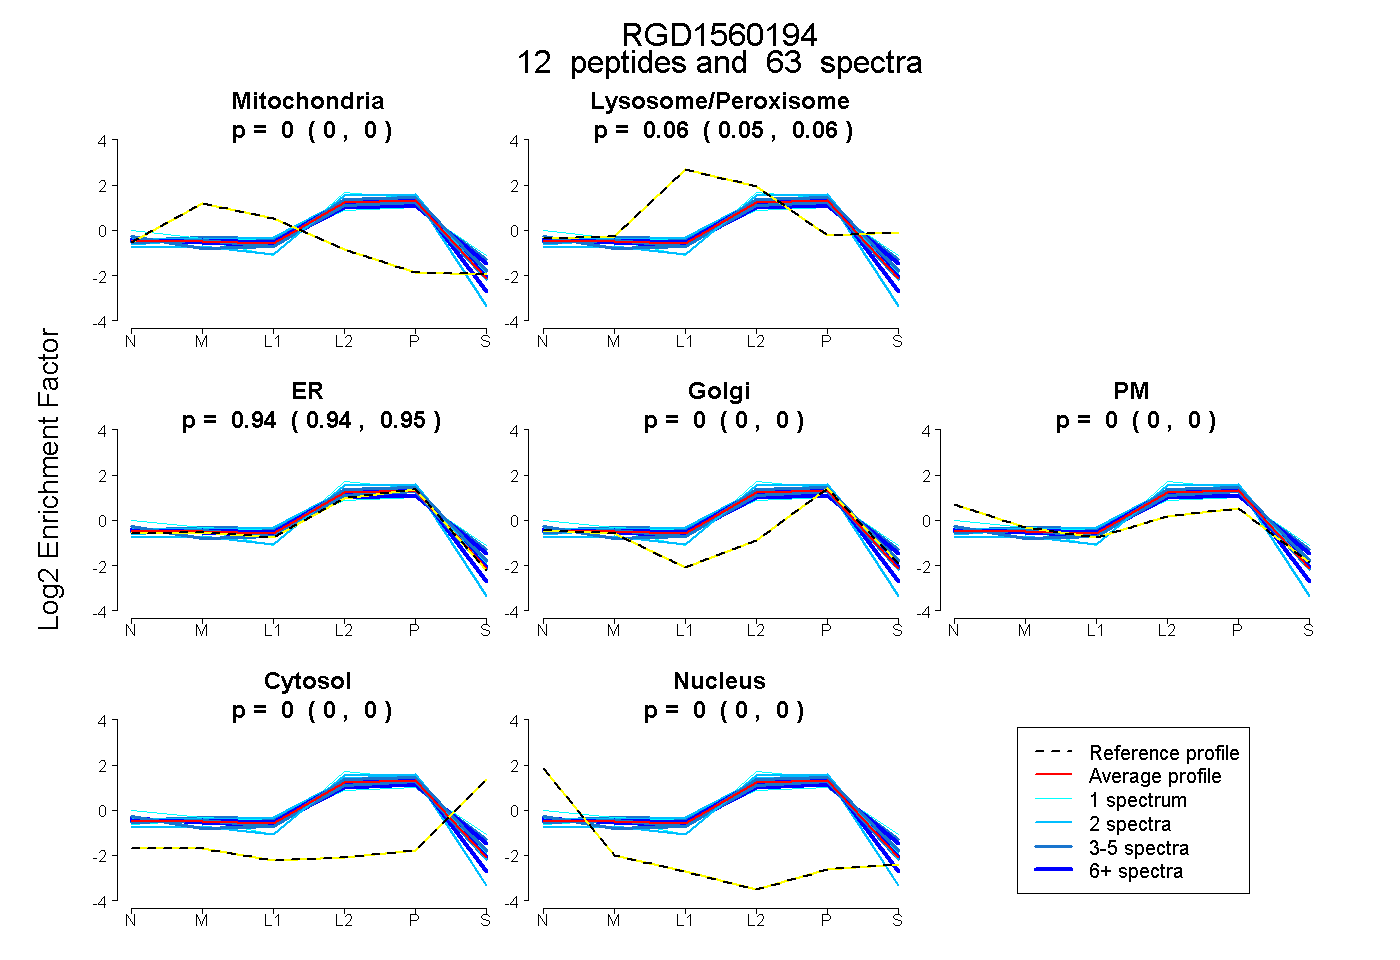 |
0.000
0.000 | 0.000 |
|
0.056
0.051 | 0.061 |
|
0.944
0.938 | 0.948 |
0.000
0.000 | 0.000 |
0.000
0.000 | 0.000 |
0.000
0.000 | 0.000 |
0.000
0.000 | 0.000 |
|
| | | Plot |
|
Lyso |
|
|
|
|
|
|
|
Other |
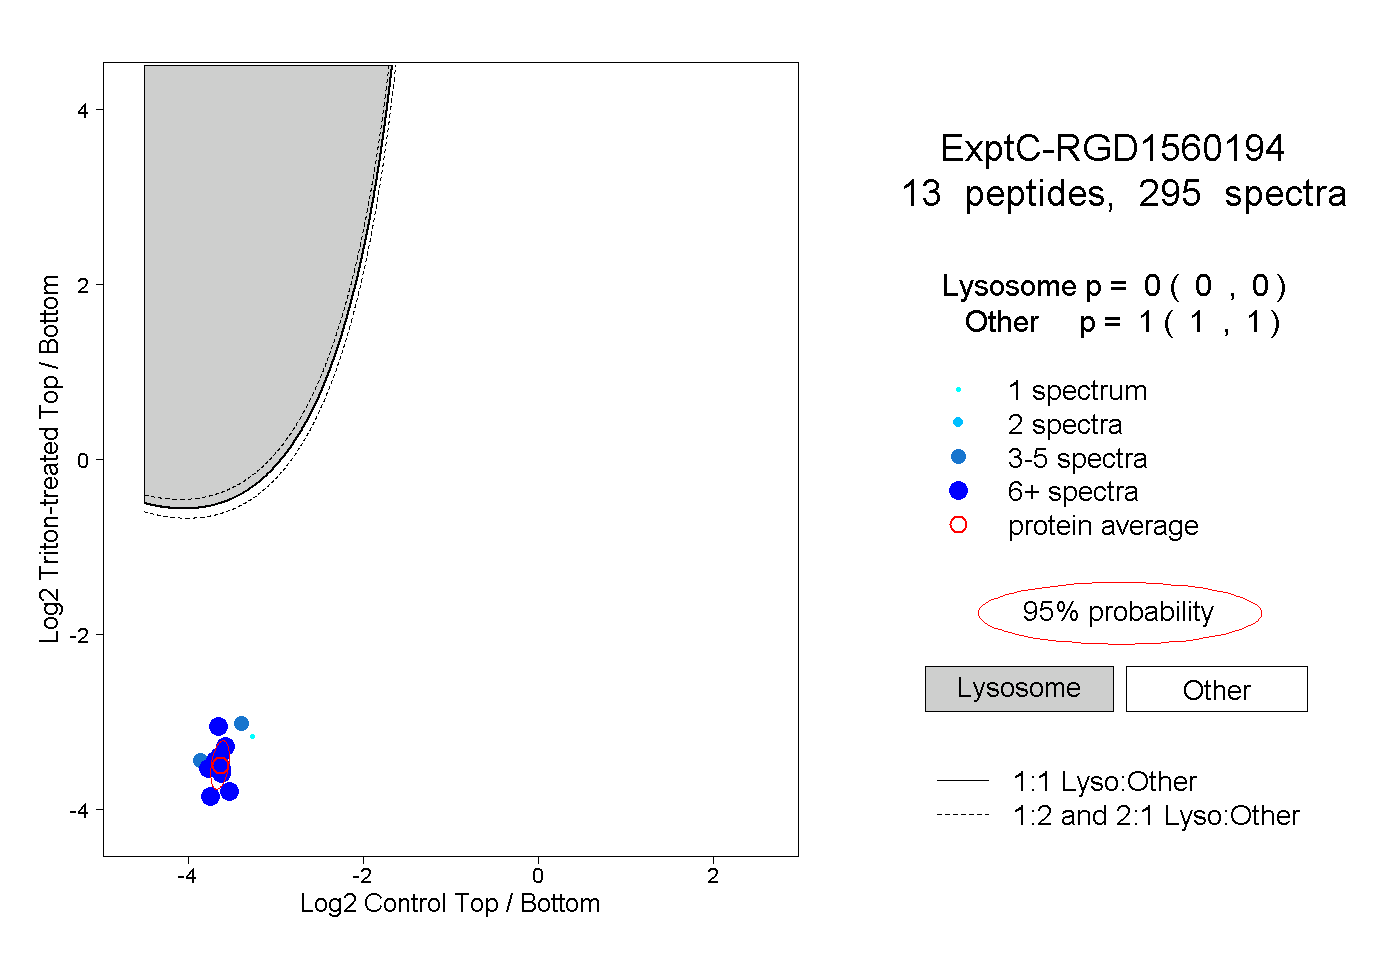
| Expt C |
13
peptides |
295
spectra |
 |
|
0.000
0.000 | 0.000 |
|
|
|
|
|
|
|
1.000
1.000 | 1.000 |
| 50 spectra, RPPVLR |
|
0.000 |
|
|
|
|
|
|
|
1.000 |
| 12 spectra, HWGGNVLGPK |
|
0.000 |
|
|
|
|
|
|
|
1.000 |
| 5 spectra, AGVNTVTTLVENK |
|
0.000 |
|
|
|
|
|
|
|
1.000 |
| 28 spectra, QTATQLLK |
|
0.000 |
|
|
|
|
|
|
|
1.000 |
| 28 spectra, AILYK |
|
0.000 |
|
|
|
|
|
|
|
1.000 |
| 38 spectra, VAPAPAVVK |
|
0.000 |
|
|
|
|
|
|
|
1.000 |
| 17 spectra, MGVPYCIIK |
|
0.000 |
|
|
|
|
|
|
|
1.000 |
| 41 spectra, LVEALR |
|
0.000 |
|
|
|
|
|
|
|
1.000 |
| 22 spectra, VVNPLFEK |
|
0.000 |
|
|
|
|
|
|
|
1.000 |
| 5 spectra, YDEIR |
|
0.000 |
|
|
|
|
|
|
|
1.000 |
| 25 spectra, GDVPTK |
|
0.000 |
|
|
|
|
|
|
|
1.000 |
| 23 spectra, YRPETK |
|
0.000 |
|
|
|
|
|
|
|
1.000 |
| 1 spectrum, NFGIGQDIQPK |
|
0.000 |
|
|
|
|
|
|
|
1.000 |
| | | Plot |
|
Lyso |
|
|
|
|
|
|
|
Other |
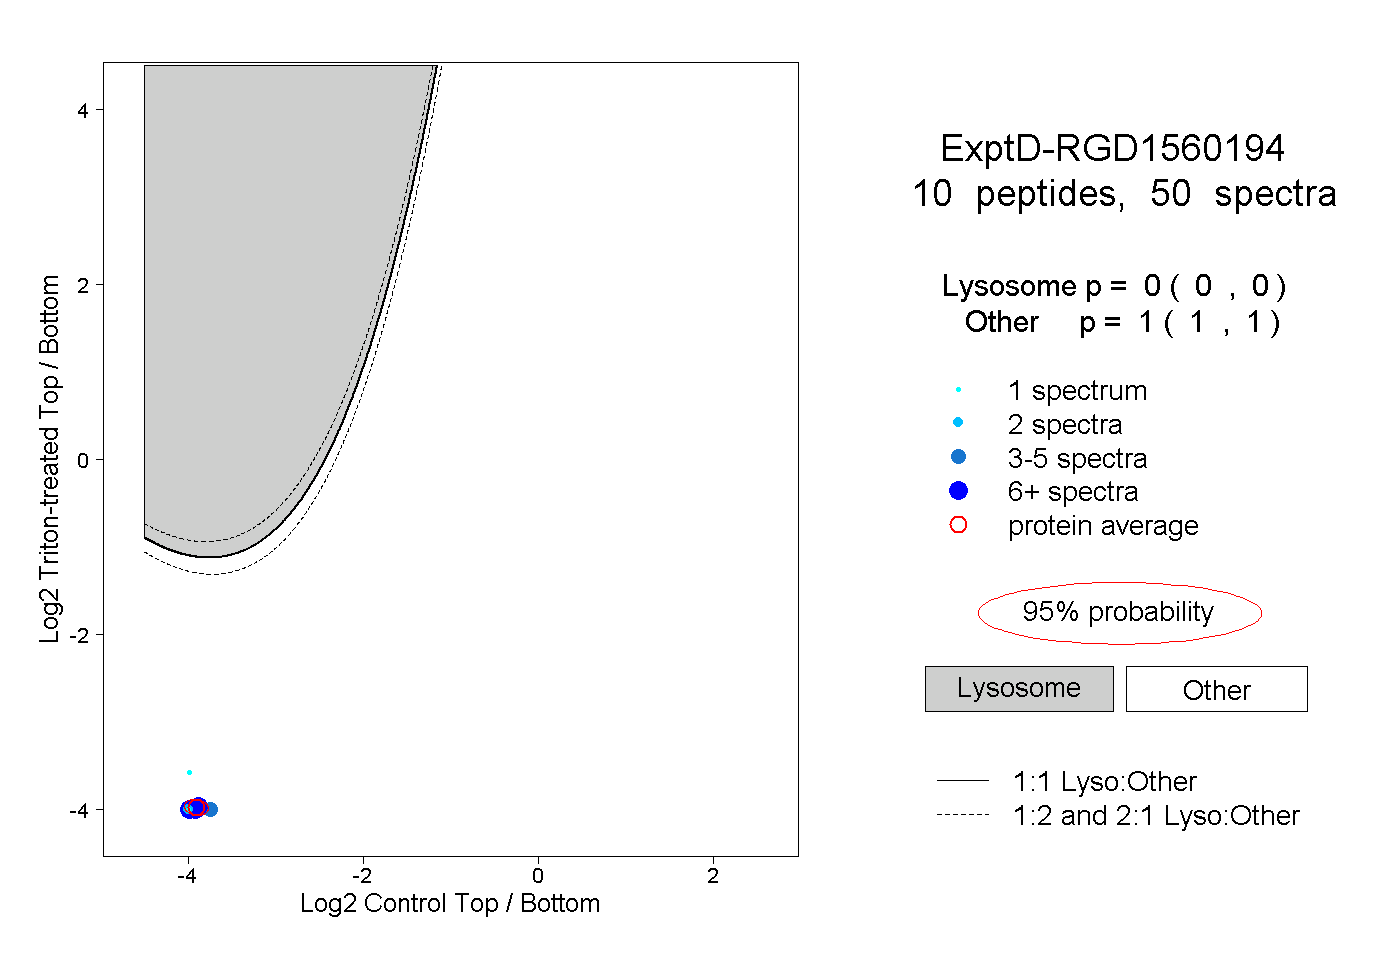
| Expt D |
10
peptides |
50
spectra |
 |
|
0.000
0.000 | 0.000 |
|
|
|
|
|
|
|
1.000
1.000 | 1.000 |