 14
14peptides
spectra
0.051 | 0.058
0.000 | 0.000
0.000 | 0.000
0.879 | 0.886
0.000 | 0.000
0.000 | 0.000
0.030 | 0.041
0.023 | 0.030
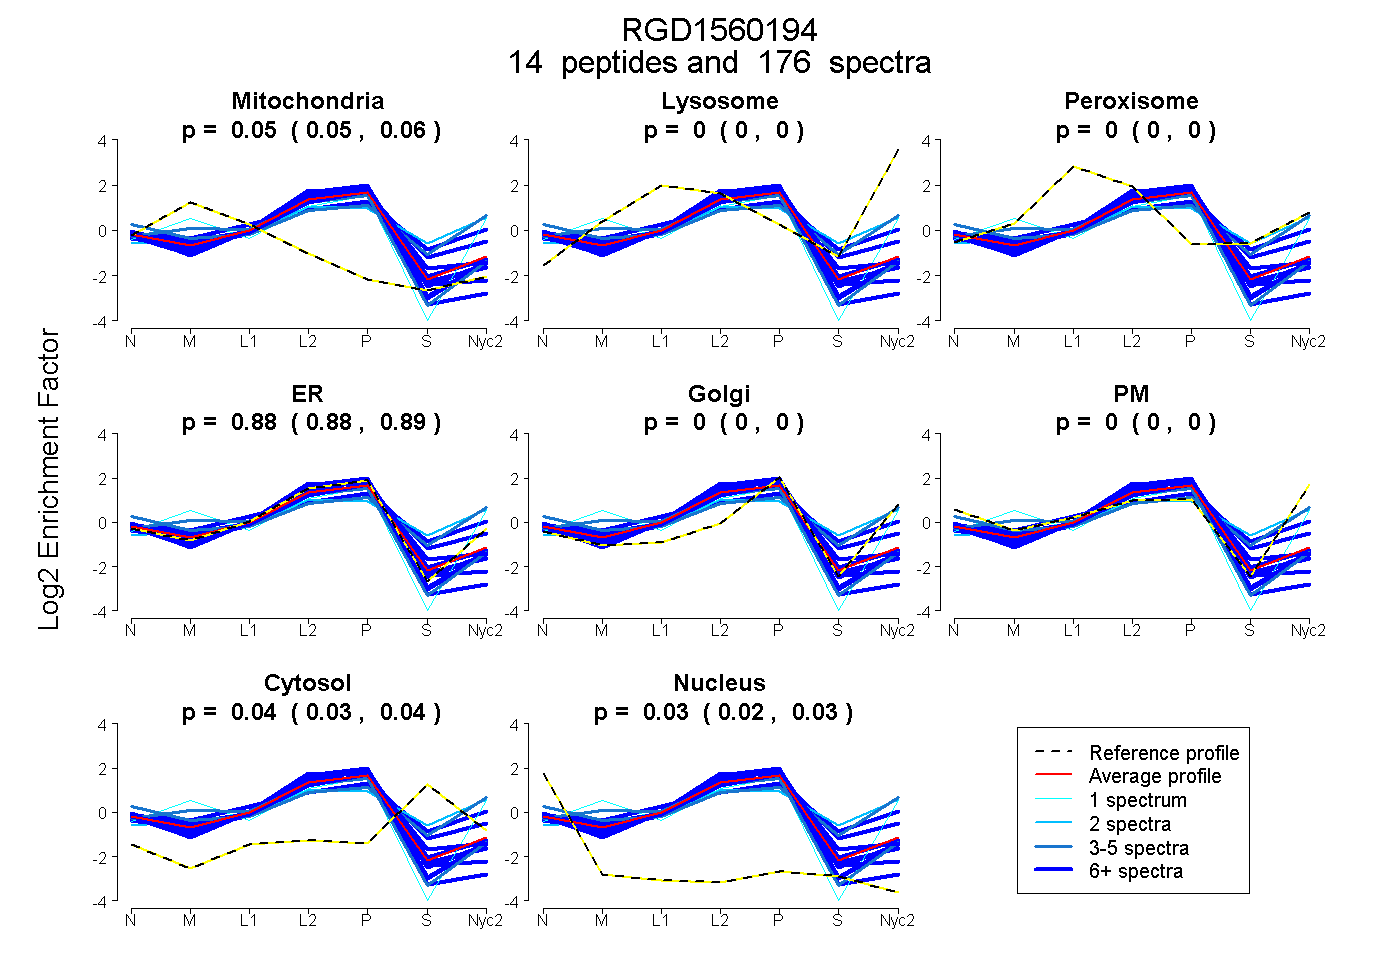
| Plot | Mito | Lyso | Perox | ER | Golgi | PM | Cytosol | Nucleus | |||||
| Expt A |
14 peptides |
176 spectra |
|
0.055 0.051 | 0.058 |
0.000 0.000 | 0.000 |
0.000 0.000 | 0.000 |
0.883 0.879 | 0.886 |
0.000 0.000 | 0.000 |
0.000 0.000 | 0.000 |
0.036 0.030 | 0.041 |
0.026 0.023 | 0.030 |
| 98 spectra, RPPVLR | 0.000 | 0.000 | 0.000 | 0.909 | 0.000 | 0.000 | 0.016 | 0.075 | ||
| 8 spectra, HWGGNVLGPK | 0.000 | 0.000 | 0.077 | 0.752 | 0.000 | 0.000 | 0.172 | 0.000 | ||
| 6 spectra, AGVNTVTTLVENK | 0.000 | 0.000 | 0.274 | 0.362 | 0.229 | 0.000 | 0.135 | 0.000 | ||
| 3 spectra, TNYNDR | 0.000 | 0.000 | 0.066 | 0.217 | 0.007 | 0.528 | 0.182 | 0.000 | ||
| 1 spectrum, TCTTVAFTQVNSEDK | 0.100 | 0.000 | 0.000 | 0.497 | 0.103 | 0.300 | 0.000 | 0.000 | ||
| 7 spectra, QTATQLLK | 0.089 | 0.000 | 0.000 | 0.834 | 0.000 | 0.000 | 0.000 | 0.076 | ||
| 8 spectra, VAPAPAVVK | 0.000 | 0.000 | 0.000 | 0.887 | 0.000 | 0.000 | 0.000 | 0.113 | ||
| 2 spectra, MGVPYCIIK | 0.000 | 0.219 | 0.023 | 0.426 | 0.000 | 0.072 | 0.260 | 0.000 | ||
| 7 spectra, VVNPLFEK | 0.000 | 0.000 | 0.000 | 0.928 | 0.000 | 0.000 | 0.000 | 0.072 | ||
| 3 spectra, YDEIR | 0.197 | 0.000 | 0.000 | 0.803 | 0.000 | 0.000 | 0.000 | 0.000 | ||
| 11 spectra, GDVPTK | 0.000 | 0.000 | 0.000 | 0.909 | 0.000 | 0.000 | 0.059 | 0.032 | ||
| 8 spectra, YRPETK | 0.050 | 0.000 | 0.000 | 0.827 | 0.000 | 0.000 | 0.109 | 0.013 | ||
| 8 spectra, LVEAIR | 0.000 | 0.000 | 0.000 | 0.946 | 0.000 | 0.000 | 0.000 | 0.054 | ||
| 6 spectra, NFGIGQDIQPK | 0.017 | 0.000 | 0.000 | 0.929 | 0.000 | 0.000 | 0.000 | 0.053 |
| Plot | Mito | Lyso or Perox | ER | Golgi | PM | Cytosol | Nucleus | ||||||
| Expt B |
12 peptides |
63 spectra |
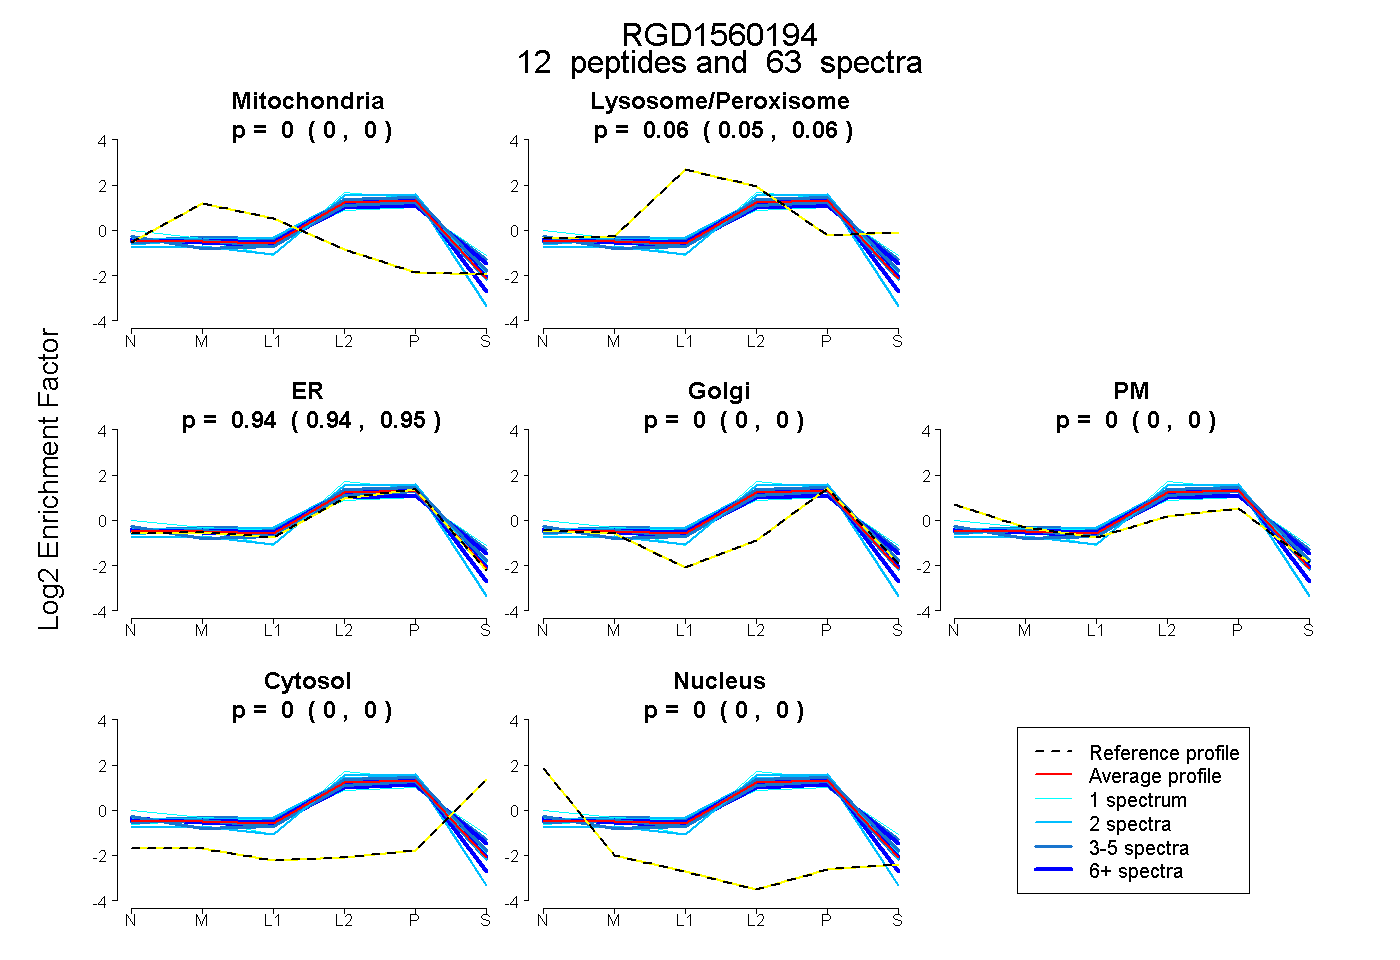 |
0.000 0.000 | 0.000 |
0.056 0.051 | 0.061 |
0.944 0.938 | 0.948 |
0.000 0.000 | 0.000 |
0.000 0.000 | 0.000 |
0.000 0.000 | 0.000 |
0.000 0.000 | 0.000 |
|||
| Plot | Lyso | Other | |||||||||||
| Expt C |
13 peptides |
295 spectra |
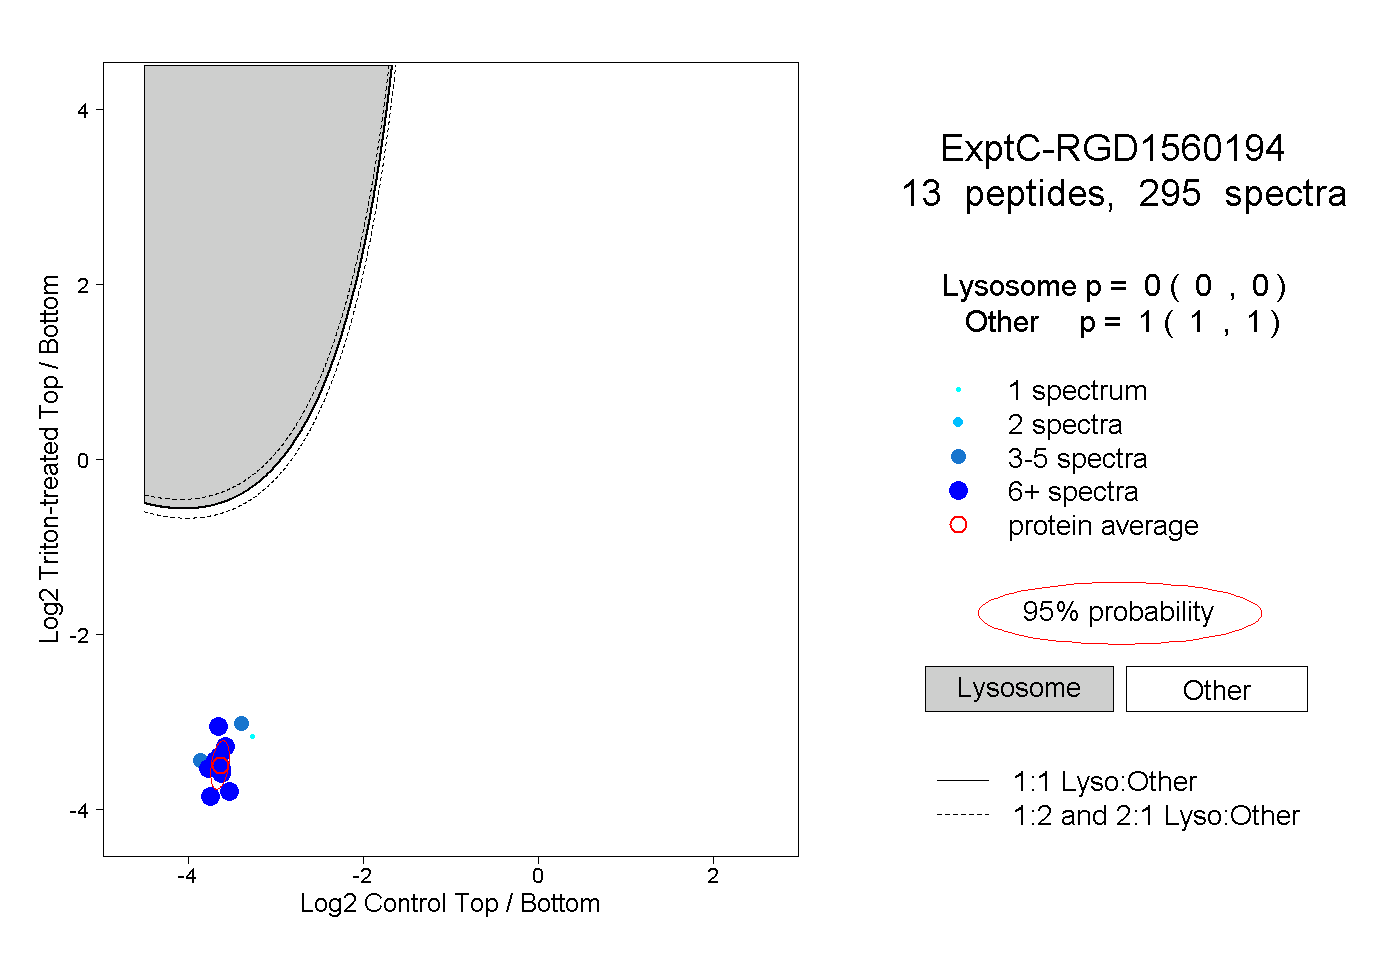 |
0.000 0.000 | 0.000 |
1.000 1.000 | 1.000 |
||||||||
| Plot | Lyso | Other | |||||||||||
| Expt D |
10 peptides |
50 spectra |
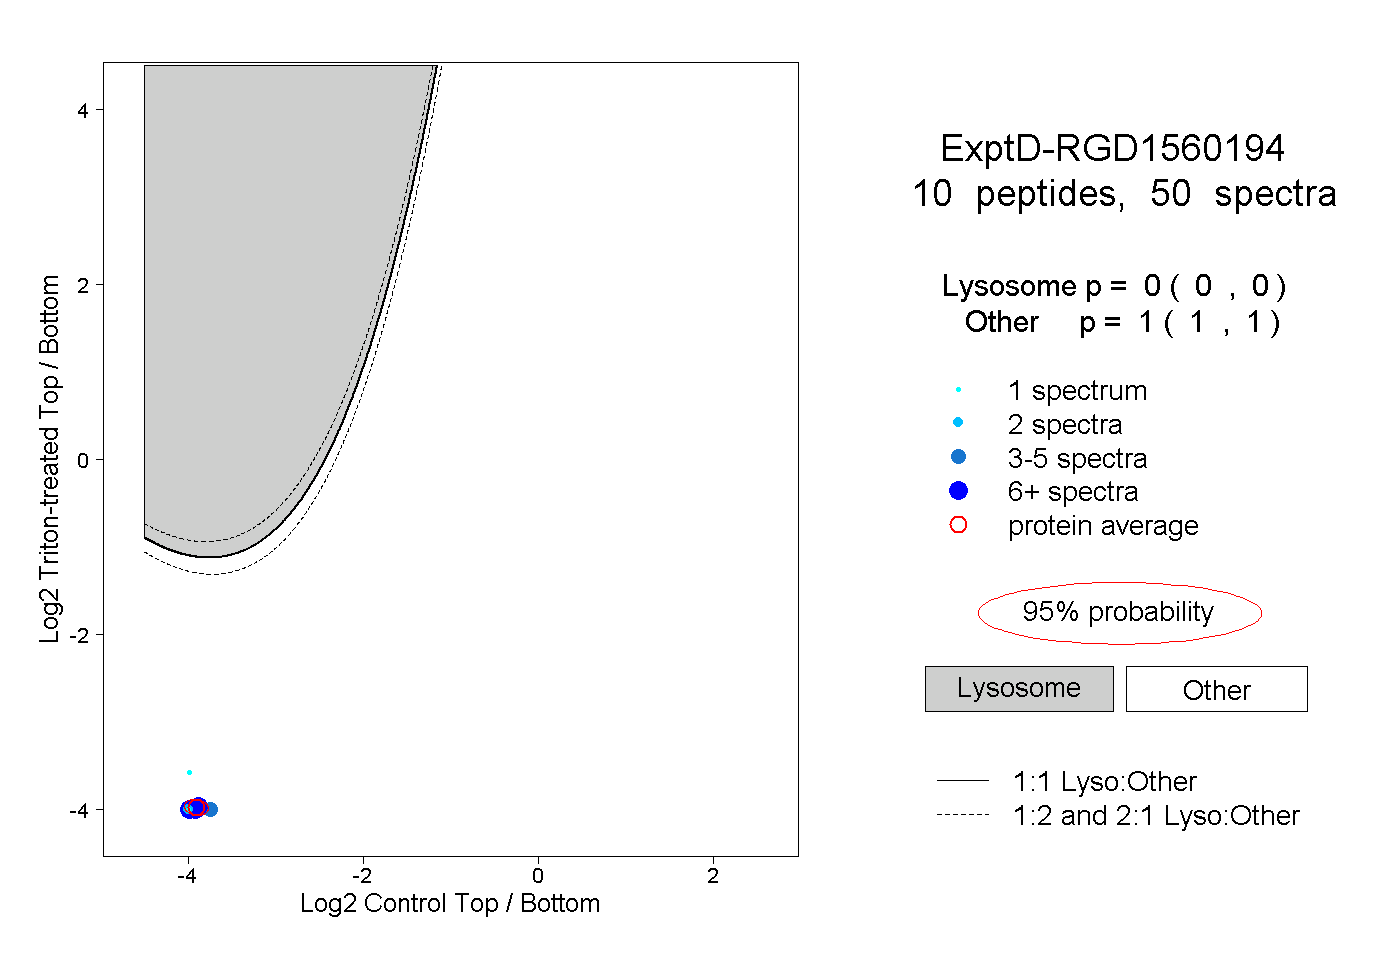 |
0.000 0.000 | 0.000 |
1.000 1.000 | 1.000 |