 2
2peptides
spectra
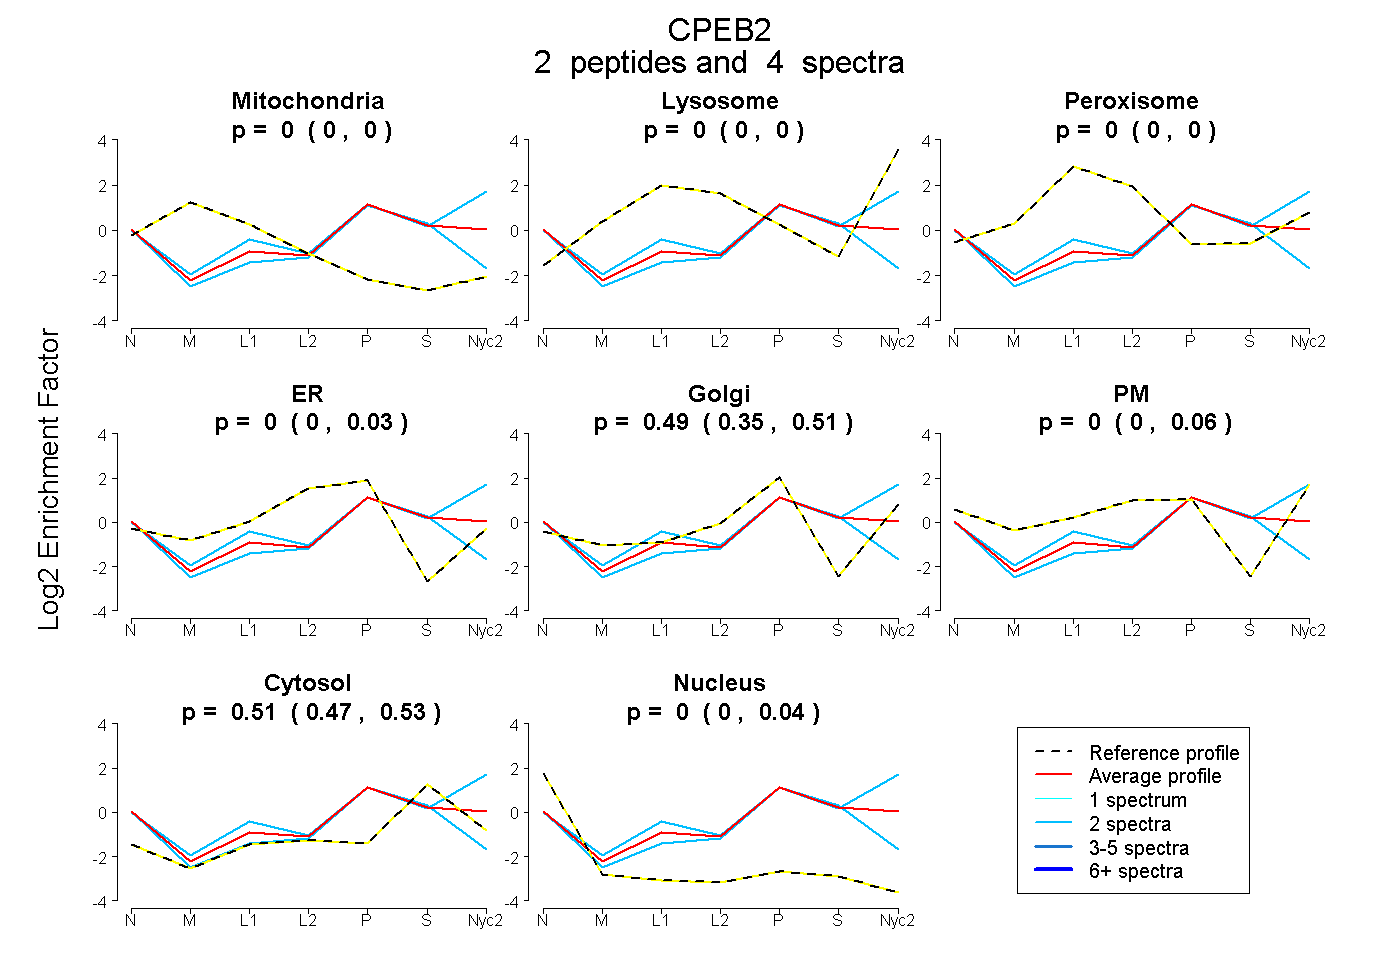
0.000 | 0.000
0.000 | 0.000
0.000 | 0.000
0.000 | 0.032
0.349 | 0.511
0.000 | 0.063
0.465 | 0.528
0.000 | 0.041
2peptides
spectra
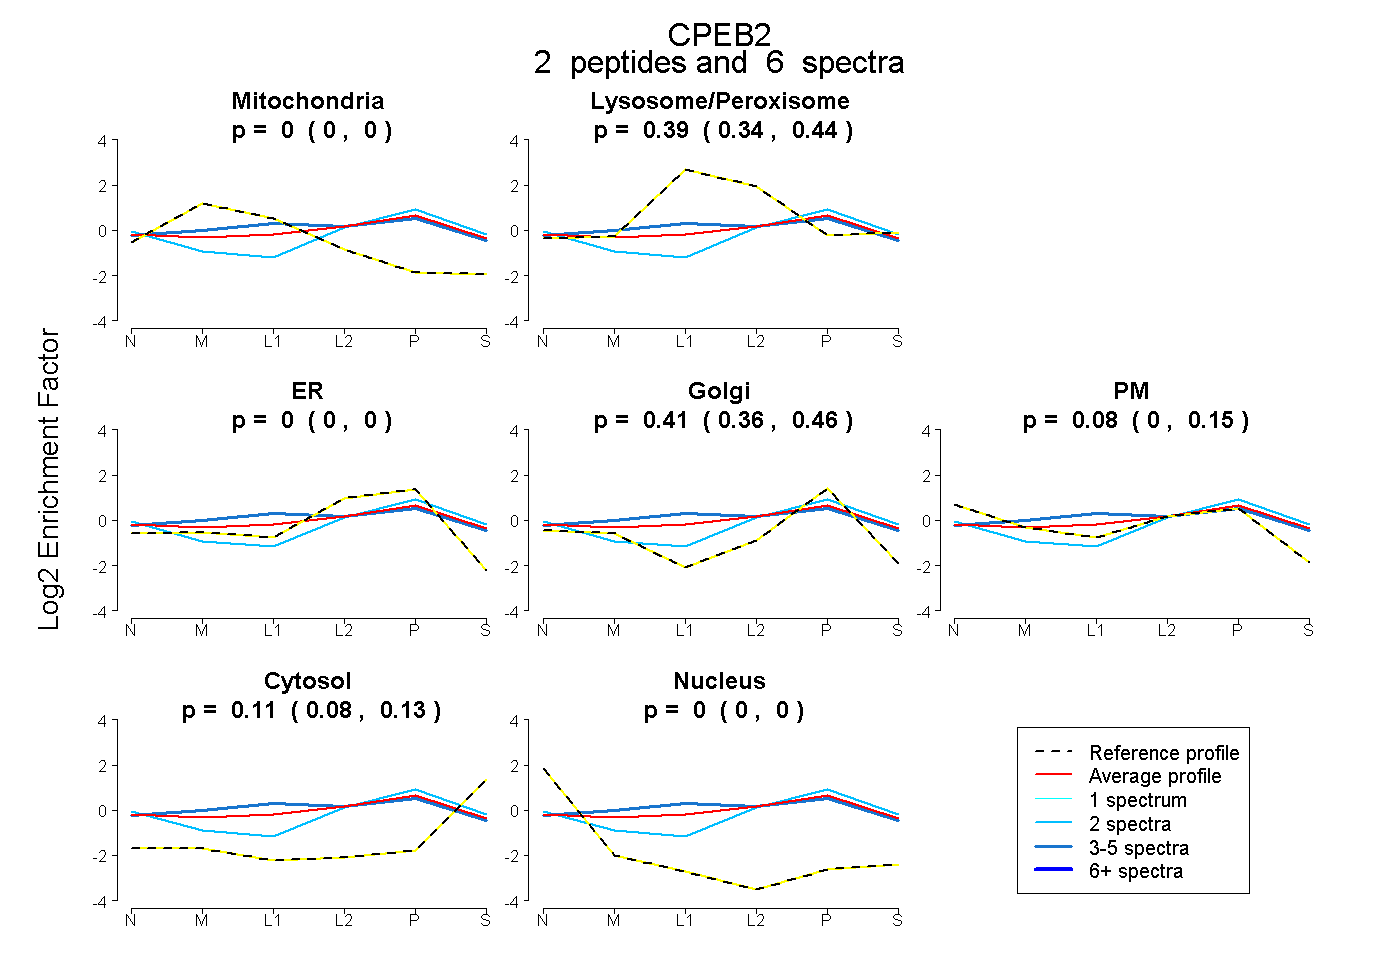
0.000 | 0.000
0.337 | 0.437
0.000 | 0.000
0.358 | 0.463
0.001 | 0.153
0.084 | 0.130
0.000 | 0.000
1peptide
spectra
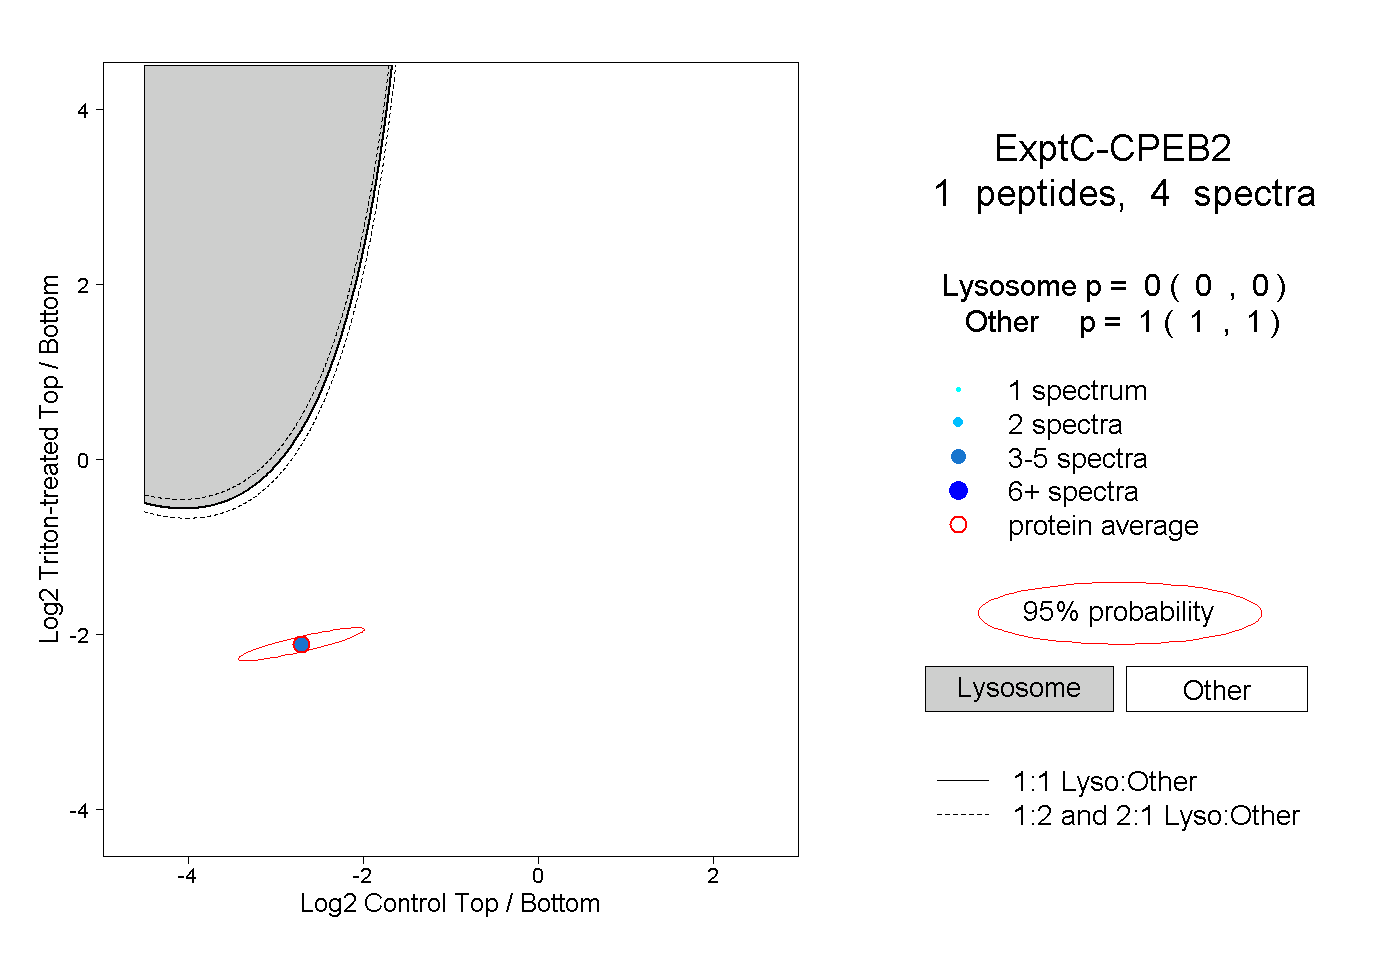
0.000 | 0.000
1.000 | 1.000