 2
2peptides
spectra
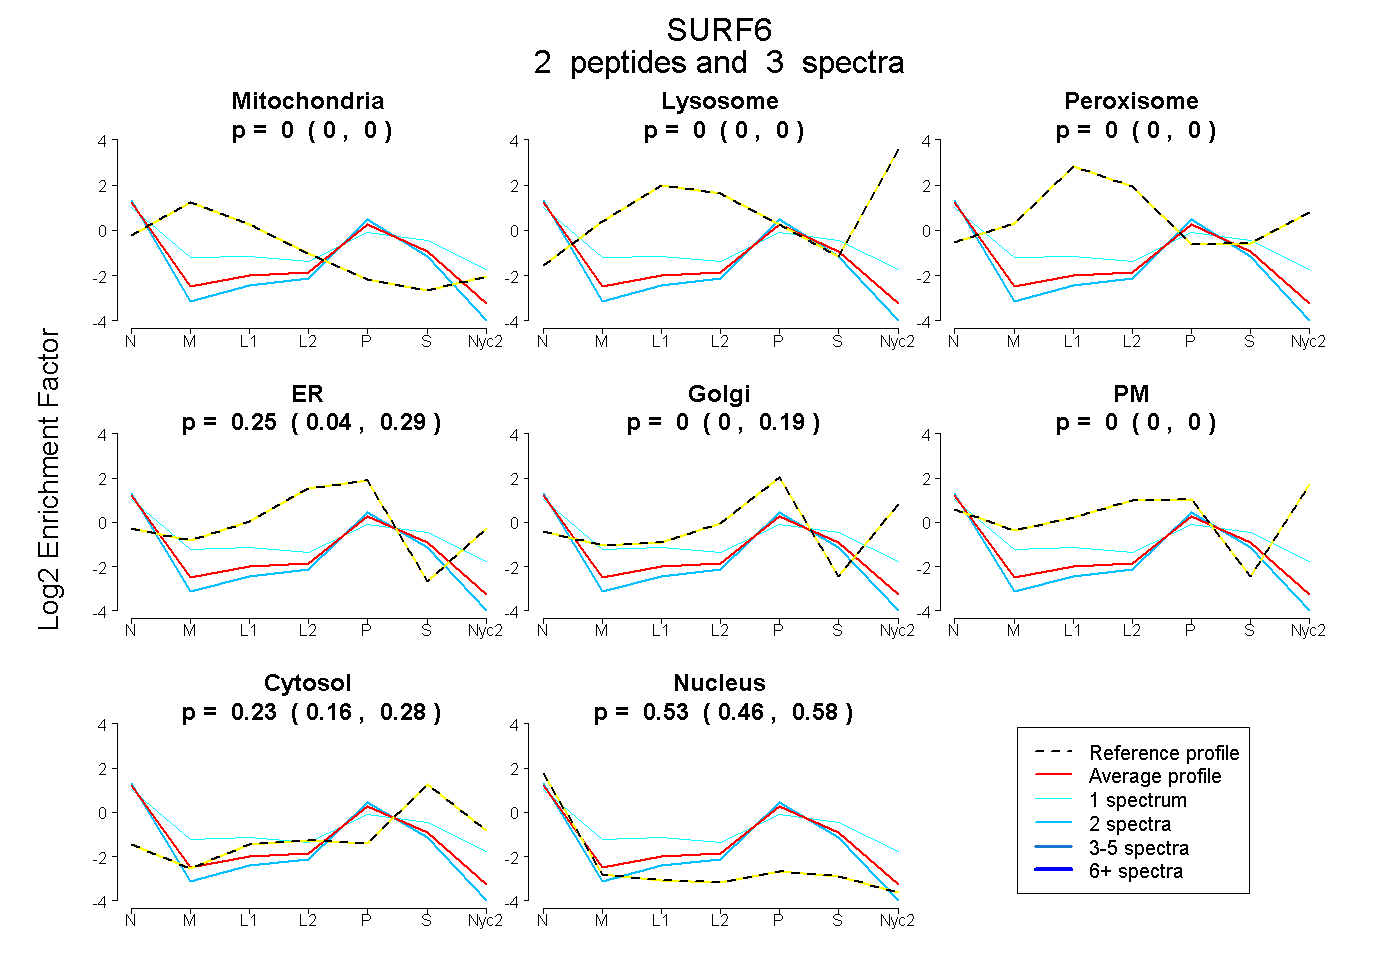
0.000 | 0.000
0.000 | 0.000
0.000 | 0.000
0.037 | 0.288
0.000 | 0.194
0.000 | 0.000
0.161 | 0.275
0.456 | 0.583
| Plot | Mito | Lyso | Perox | ER | Golgi | PM | Cytosol | Nucleus | |||||
| Expt A |
2 peptides |
3 spectra |
|
0.000 0.000 | 0.000 |
0.000 0.000 | 0.000 |
0.000 0.000 | 0.000 |
0.246 0.037 | 0.288 |
0.000 0.000 | 0.194 |
0.000 0.000 | 0.000 |
0.228 0.161 | 0.275 |
0.526 0.456 | 0.583 |
| 2 spectra, GNLTPLTGR | 0.000 | 0.000 | 0.000 | 0.200 | 0.000 | 0.000 | 0.163 | 0.636 | ||
| 1 spectrum, VEVAGEEPASK | 0.000 | 0.000 | 0.135 | 0.093 | 0.157 | 0.000 | 0.270 | 0.345 |
| Plot | Lyso | Other | |||||||||||
| Expt C |
1 peptide |
2 spectra |
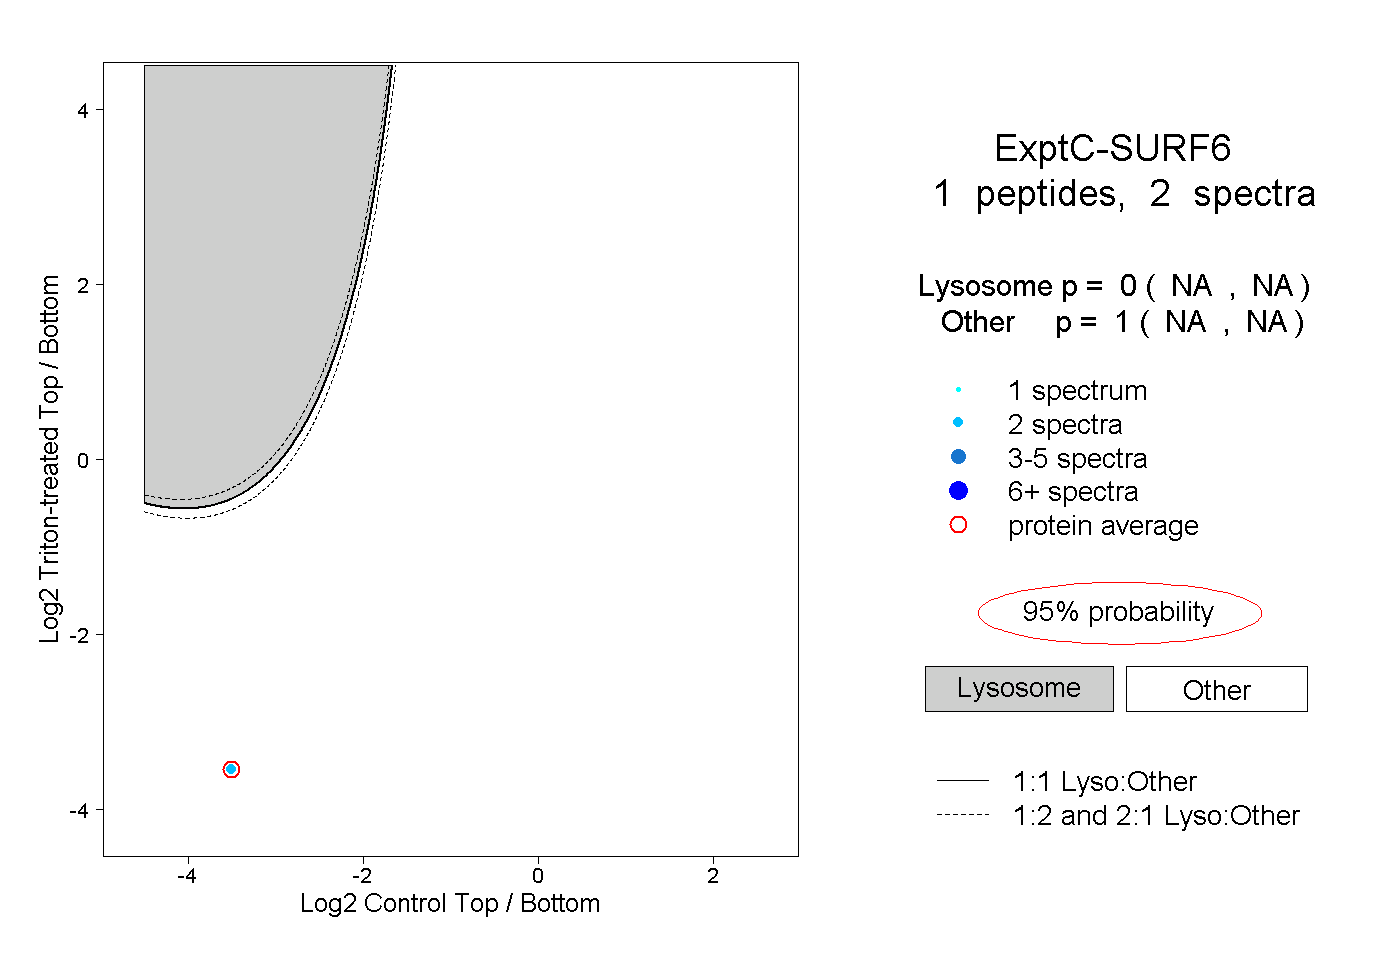 |
0.000 NA | NA |
1.000 NA | NA |