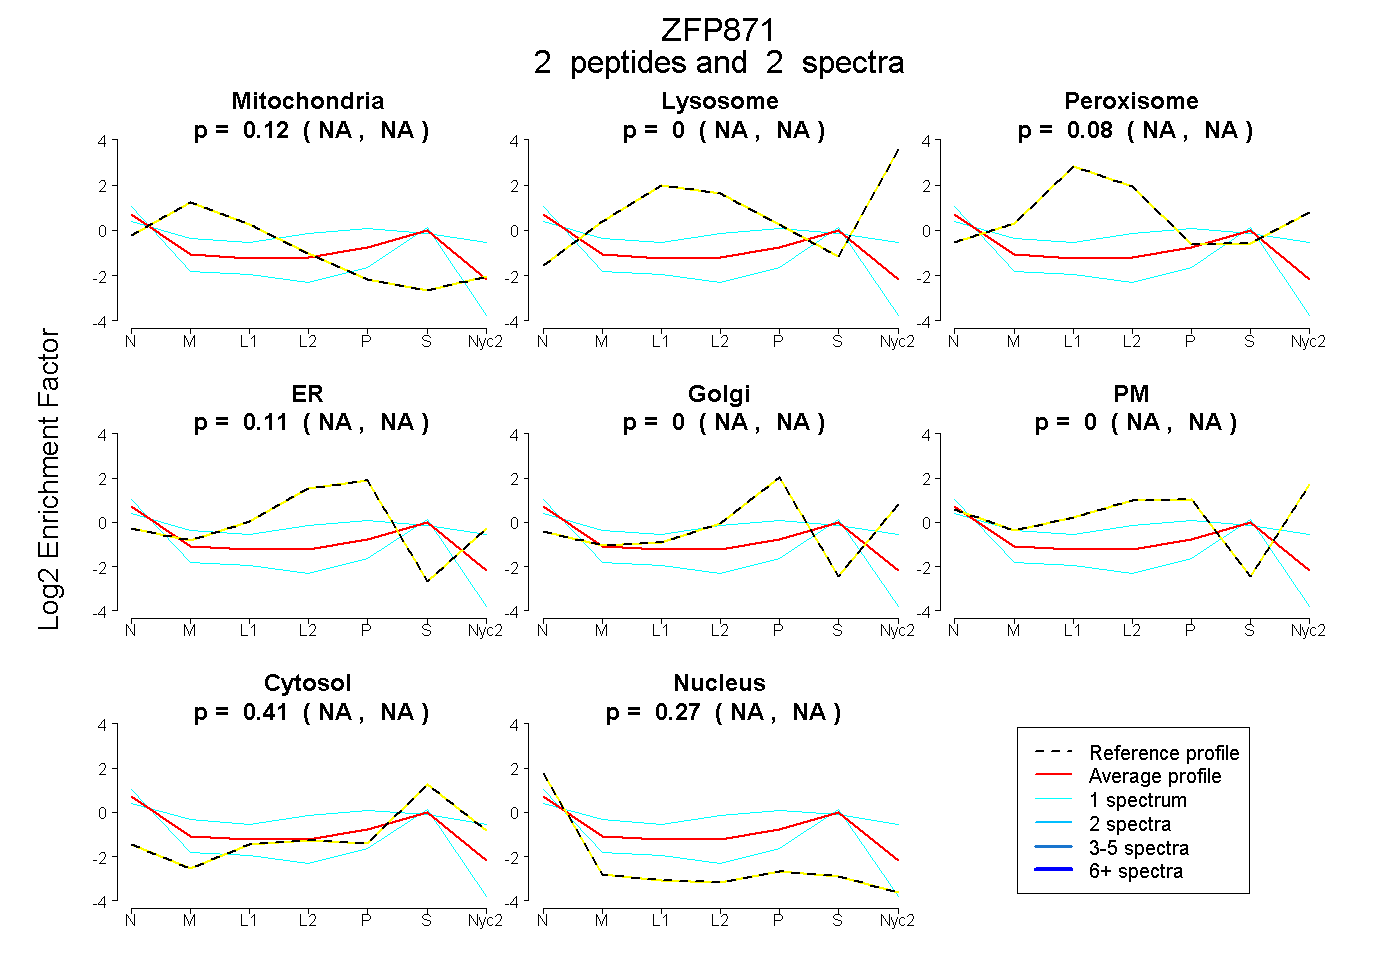
 2
2peptides
spectra
NA | NA
NA | NA
NA | NA
NA | NA
NA | NA
NA | NA
NA | NA
NA | NA
| Plot | Mito | Lyso | Perox | ER | Golgi | PM | Cytosol | Nucleus | |||||
| Expt A |
2 peptides |
2 spectra |
|
0.122 NA | NA |
0.000 NA | NA |
0.083 NA | NA |
0.110 NA | NA |
0.000 NA | NA |
0.000 NA | NA |
0.411 NA | NA |
0.274 NA | NA |
| 1 spectrum, AFITYR | 0.065 | 0.000 | 0.000 | 0.000 | 0.000 | 0.000 | 0.415 | 0.519 | ||
| 1 spectrum, ALHAVPVSYVCK | 0.158 | 0.000 | 0.051 | 0.112 | 0.000 | 0.281 | 0.395 | 0.003 |