 3
3peptides
spectra
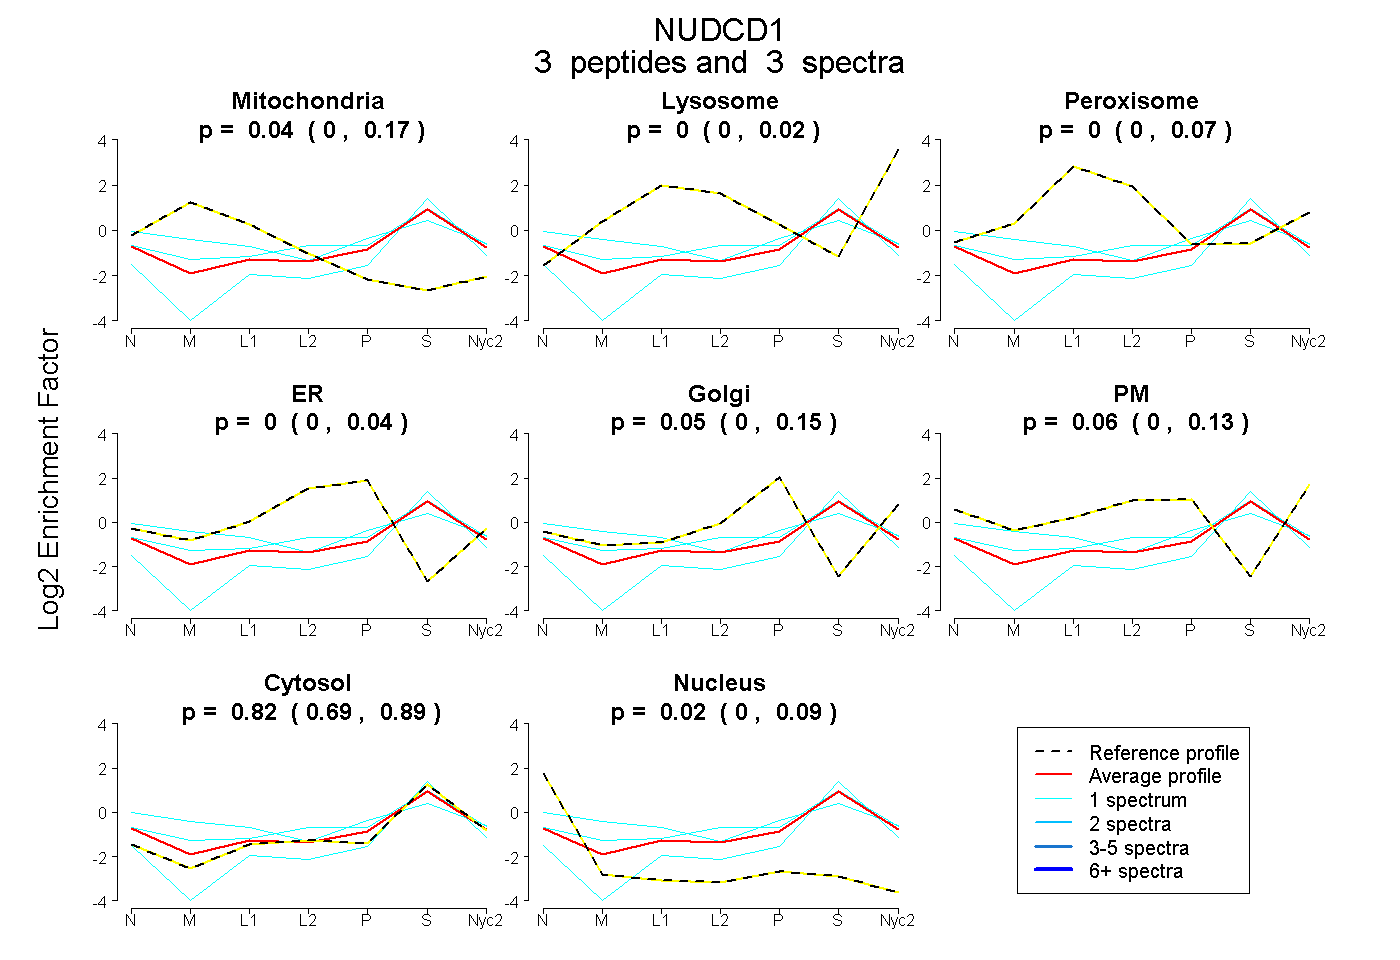
0.000 | 0.172
0.000 | 0.016
0.000 | 0.068
0.000 | 0.040
0.000 | 0.147
0.000 | 0.127
0.693 | 0.893
0.000 | 0.090
| Plot | Mito | Lyso | Perox | ER | Golgi | PM | Cytosol | Nucleus | |||||
| Expt A |
3 peptides |
3 spectra |
|
0.040 0.000 | 0.172 |
0.000 0.000 | 0.016 |
0.000 0.000 | 0.068 |
0.000 0.000 | 0.040 |
0.052 0.000 | 0.147 |
0.061 0.000 | 0.127 |
0.822 0.693 | 0.893 |
0.025 0.000 | 0.090 |
| 1 spectrum, LPEGSTK | 0.219 | 0.000 | 0.000 | 0.000 | 0.030 | 0.200 | 0.551 | 0.000 | ||
| 1 spectrum, LFVLTTK | 0.000 | 0.000 | 0.000 | 0.000 | 0.000 | 0.000 | 0.933 | 0.067 | ||
| 1 spectrum, LPTDVTACDNR | 0.048 | 0.000 | 0.052 | 0.017 | 0.000 | 0.135 | 0.747 | 0.000 |
| Plot | Lyso | Other | |||||||||||
| Expt C |
3 peptides |
4 spectra |
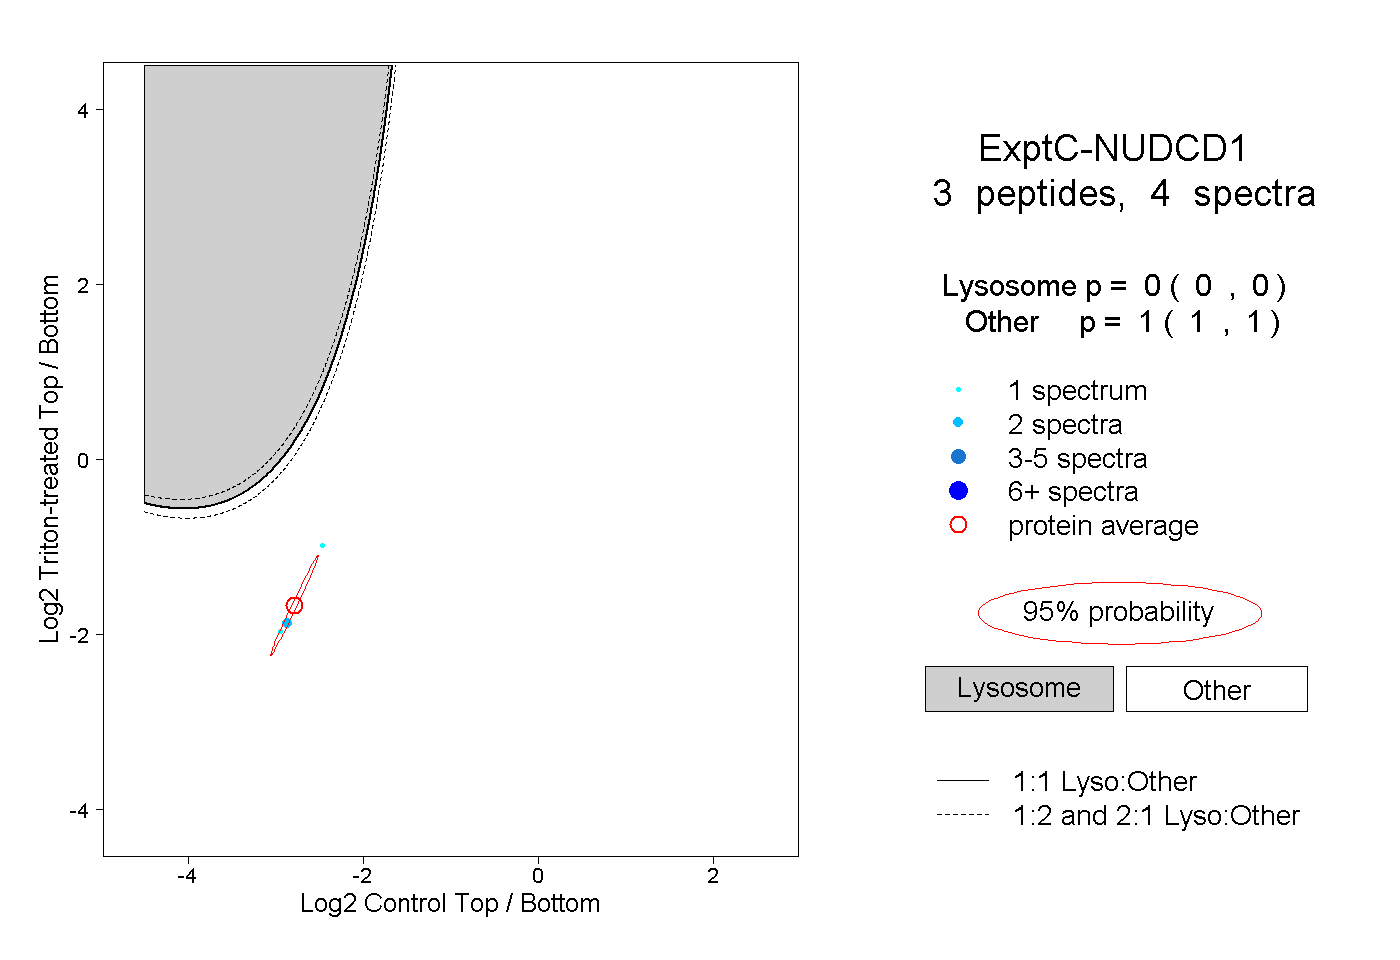 |
0.000 0.000 | 0.000 |
1.000 1.000 | 1.000 |