 2
2peptides
spectra
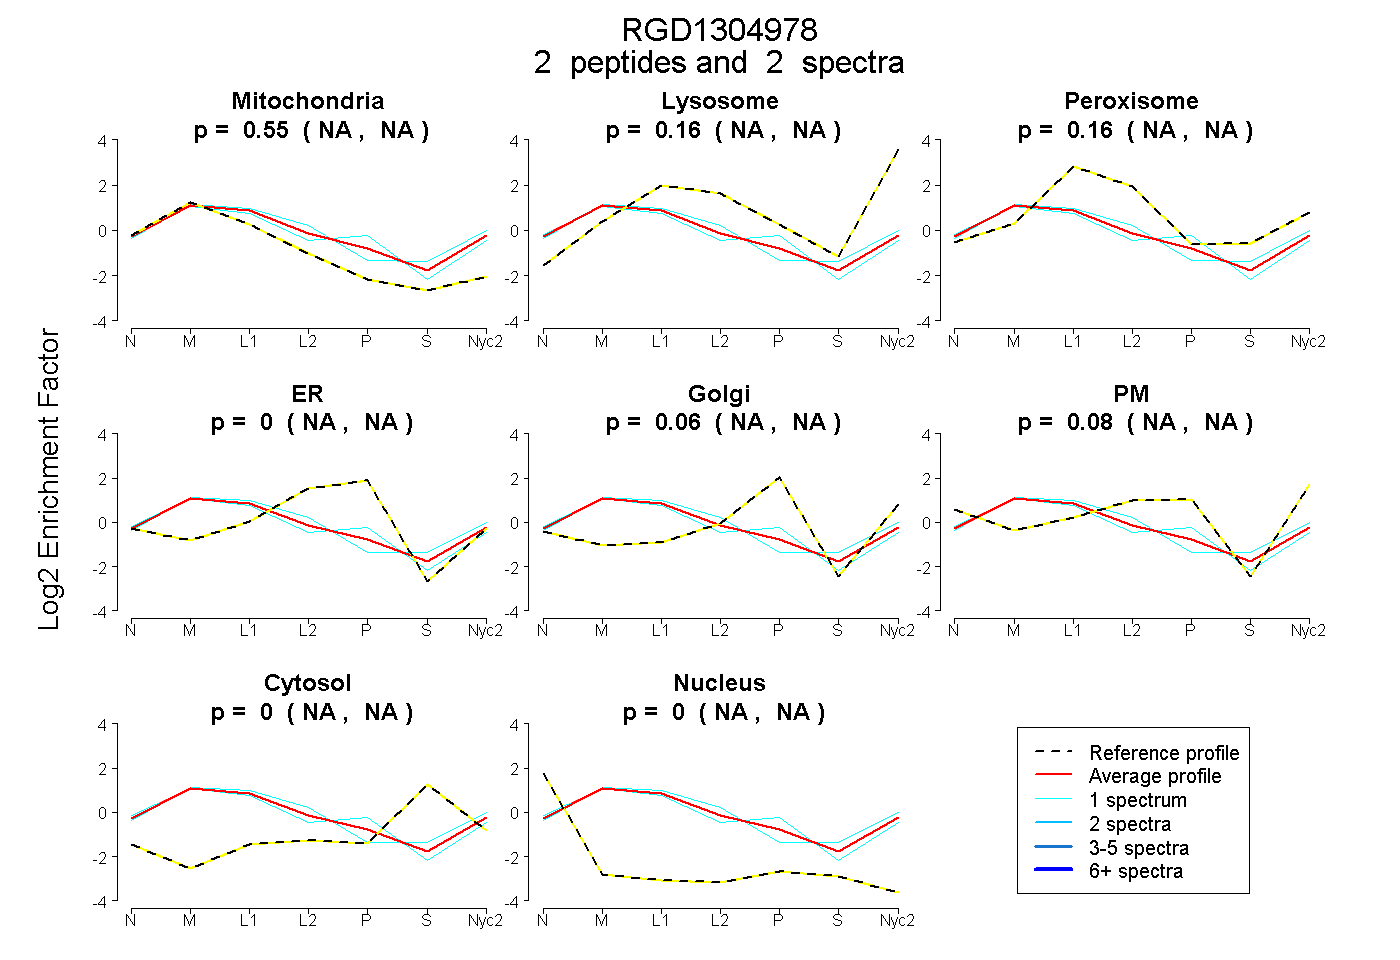
NA | NA
NA | NA
NA | NA
NA | NA
NA | NA
NA | NA
NA | NA
NA | NA
4peptides
spectra
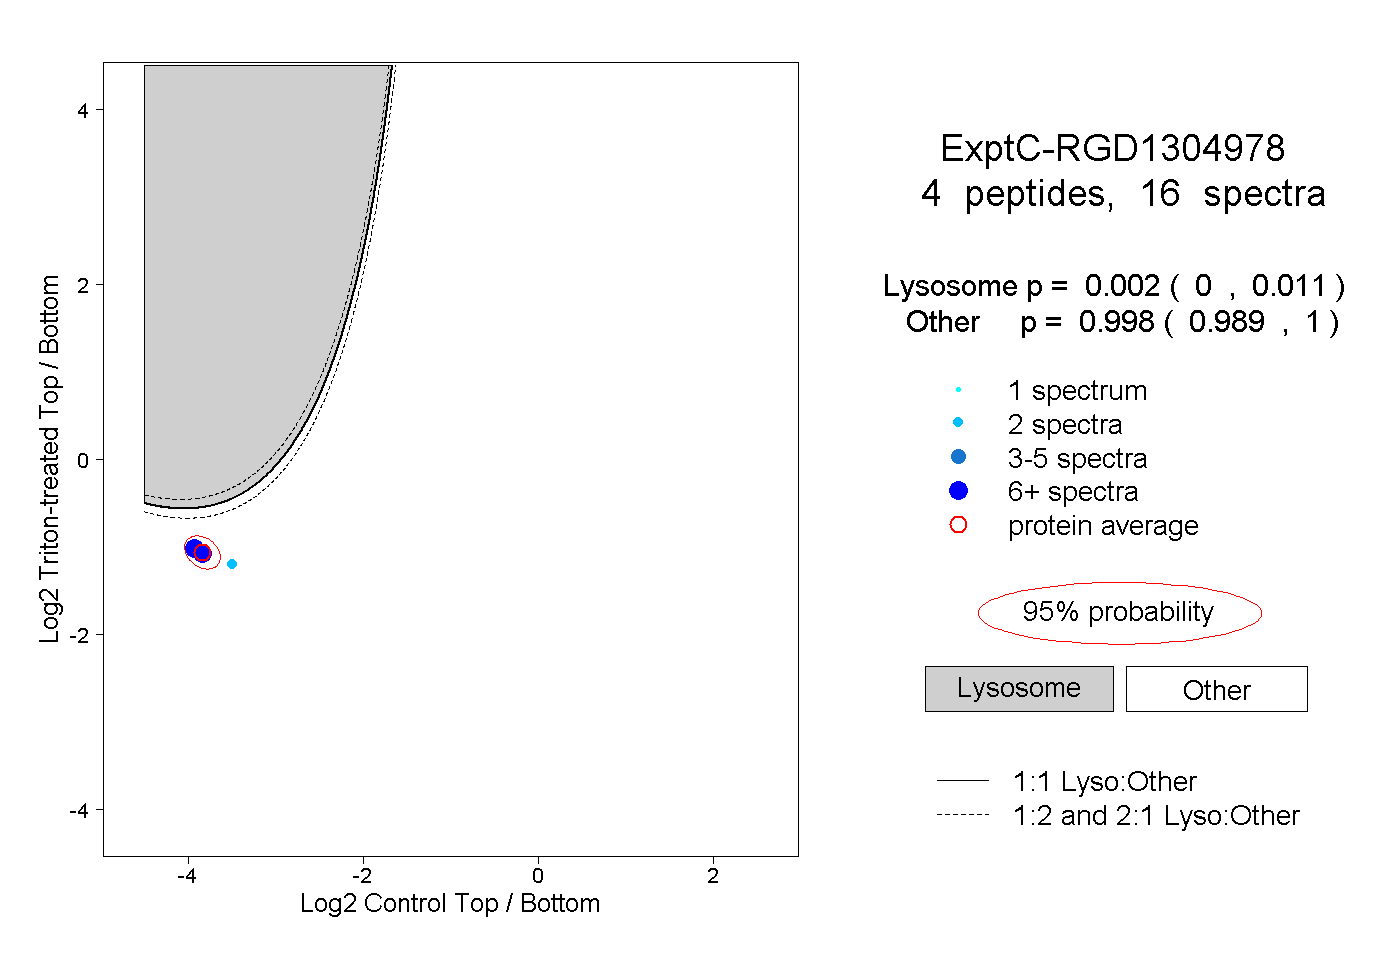
0.000 | 0.011
0.989 | 1.000
1peptide
spectrum
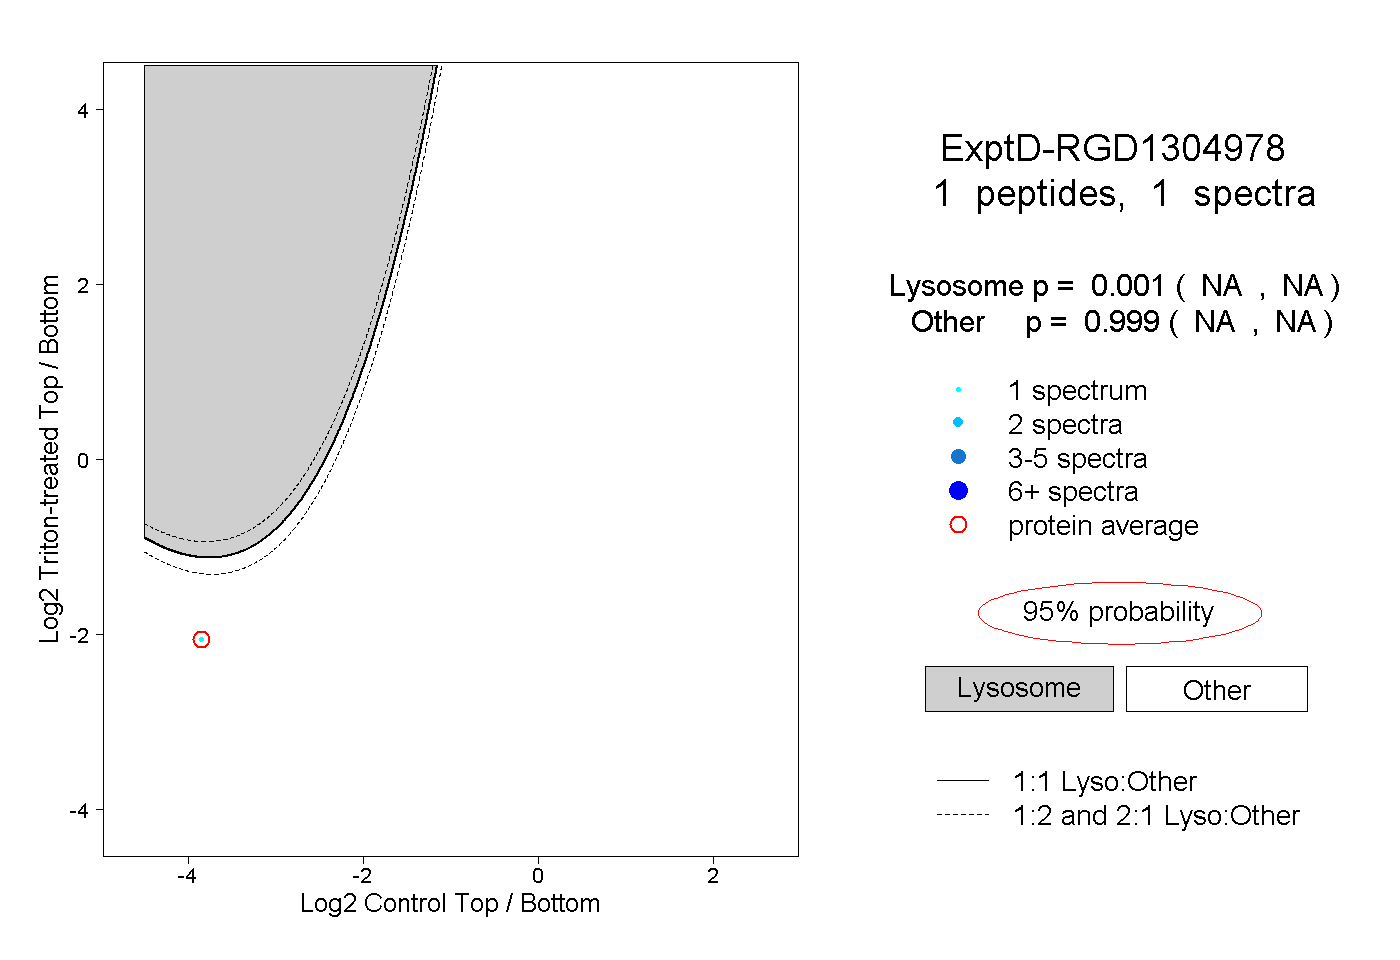
NA | NA
NA | NA
| Plot | Mito | Lyso | Perox | ER | Golgi | PM | Cytosol | Nucleus | |||||
| Expt A |
2 peptides |
2 spectra |
|
0.545 NA | NA |
0.162 NA | NA |
0.157 NA | NA |
0.000 NA | NA |
0.060 NA | NA |
0.076 NA | NA |
0.000 NA | NA |
0.000 NA | NA |
||
| Plot | Lyso | Other | |||||||||||
| Expt C |
4 peptides |
16 spectra |
|
0.002 0.000 | 0.011 |
0.998 0.989 | 1.000 |
||||||||
| Plot | Lyso | Other | |||||||||||
| Expt D |
1 peptide |
1 spectrum |
|
0.001 NA | NA |
0.999 NA | NA |