 6
6peptides
spectra
0.000 | 0.000
0.000 | 0.000
0.000 | 0.000
0.304 | 0.546
0.000 | 0.153
0.000 | 0.097
0.092 | 0.140
0.286 | 0.375
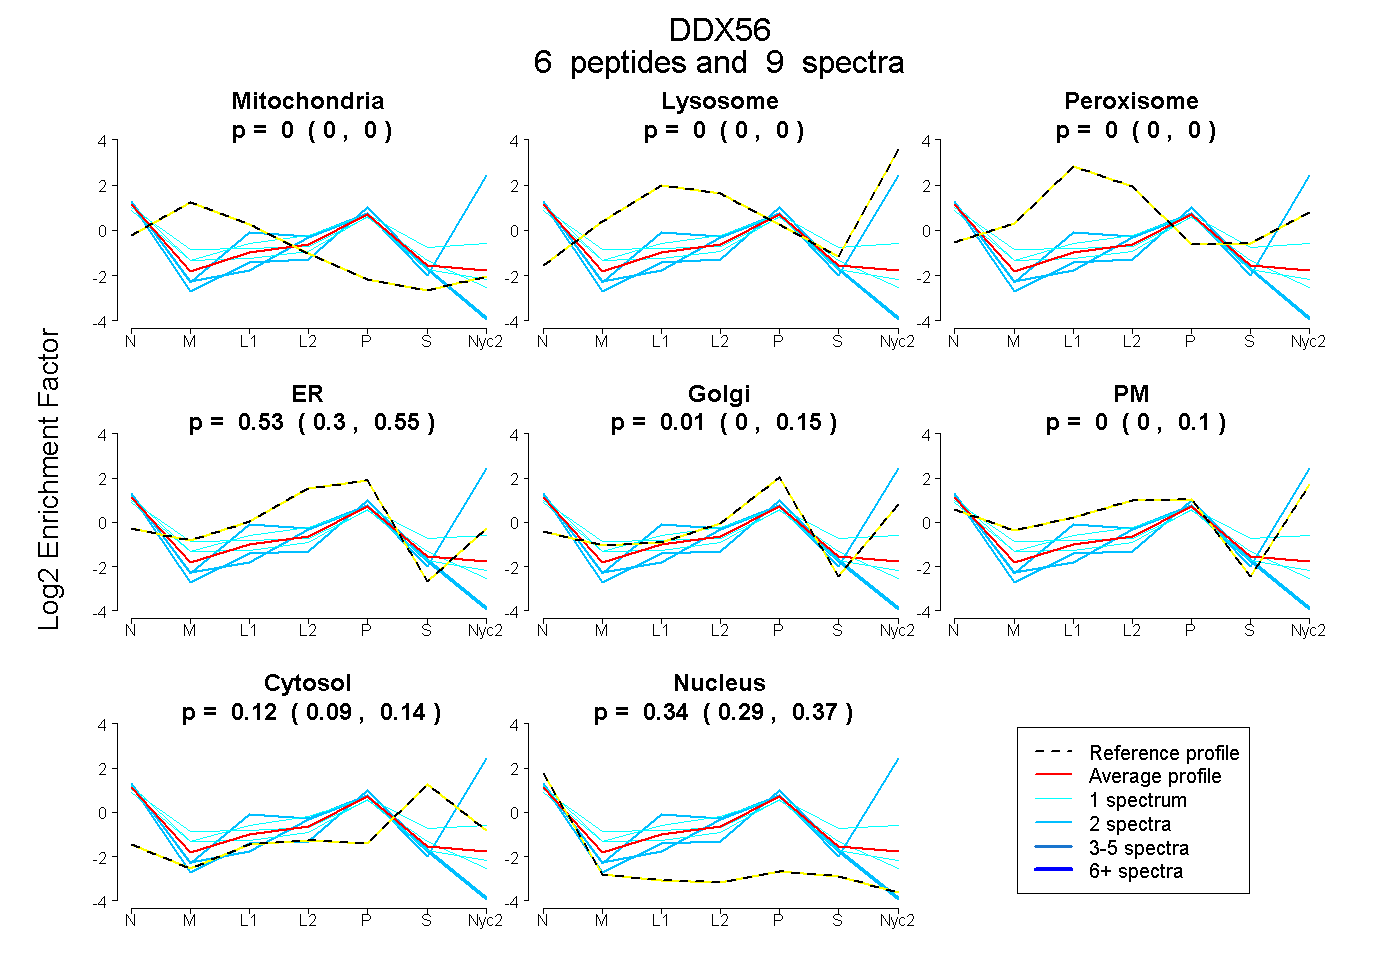
| Plot | Mito | Lyso | Perox | ER | Golgi | PM | Cytosol | Nucleus | |||||
| Expt A |
6 peptides |
9 spectra |
|
0.000 0.000 | 0.000 |
0.000 0.000 | 0.000 |
0.000 0.000 | 0.000 |
0.528 0.304 | 0.546 |
0.013 0.000 | 0.153 |
0.000 0.000 | 0.097 |
0.123 0.092 | 0.140 |
0.335 0.286 | 0.375 |
| 2 spectra, ATGPVMEQAVR | 0.000 | 0.000 | 0.000 | 0.418 | 0.000 | 0.000 | 0.033 | 0.549 | ||
| 1 spectrum, ELVLHNPVTLK | 0.108 | 0.000 | 0.000 | 0.474 | 0.000 | 0.000 | 0.111 | 0.307 | ||
| 1 spectrum, AVLMEKPDVVVGTPSR | 0.000 | 0.000 | 0.000 | 0.509 | 0.015 | 0.000 | 0.068 | 0.408 | ||
| 2 spectra, ALLFVNTLER | 0.000 | 0.000 | 0.000 | 0.000 | 0.000 | 0.832 | 0.104 | 0.064 | ||
| 1 spectrum, SLLCHLPR | 0.000 | 0.000 | 0.003 | 0.268 | 0.000 | 0.307 | 0.288 | 0.135 | ||
| 2 spectra, ASDPESGVAR | 0.000 | 0.000 | 0.000 | 0.471 | 0.000 | 0.000 | 0.000 | 0.529 |
| Plot | Mito | Lyso or Perox | ER | Golgi | PM | Cytosol | Nucleus | ||||||
| Expt B |
1 peptide |
1 spectrum |
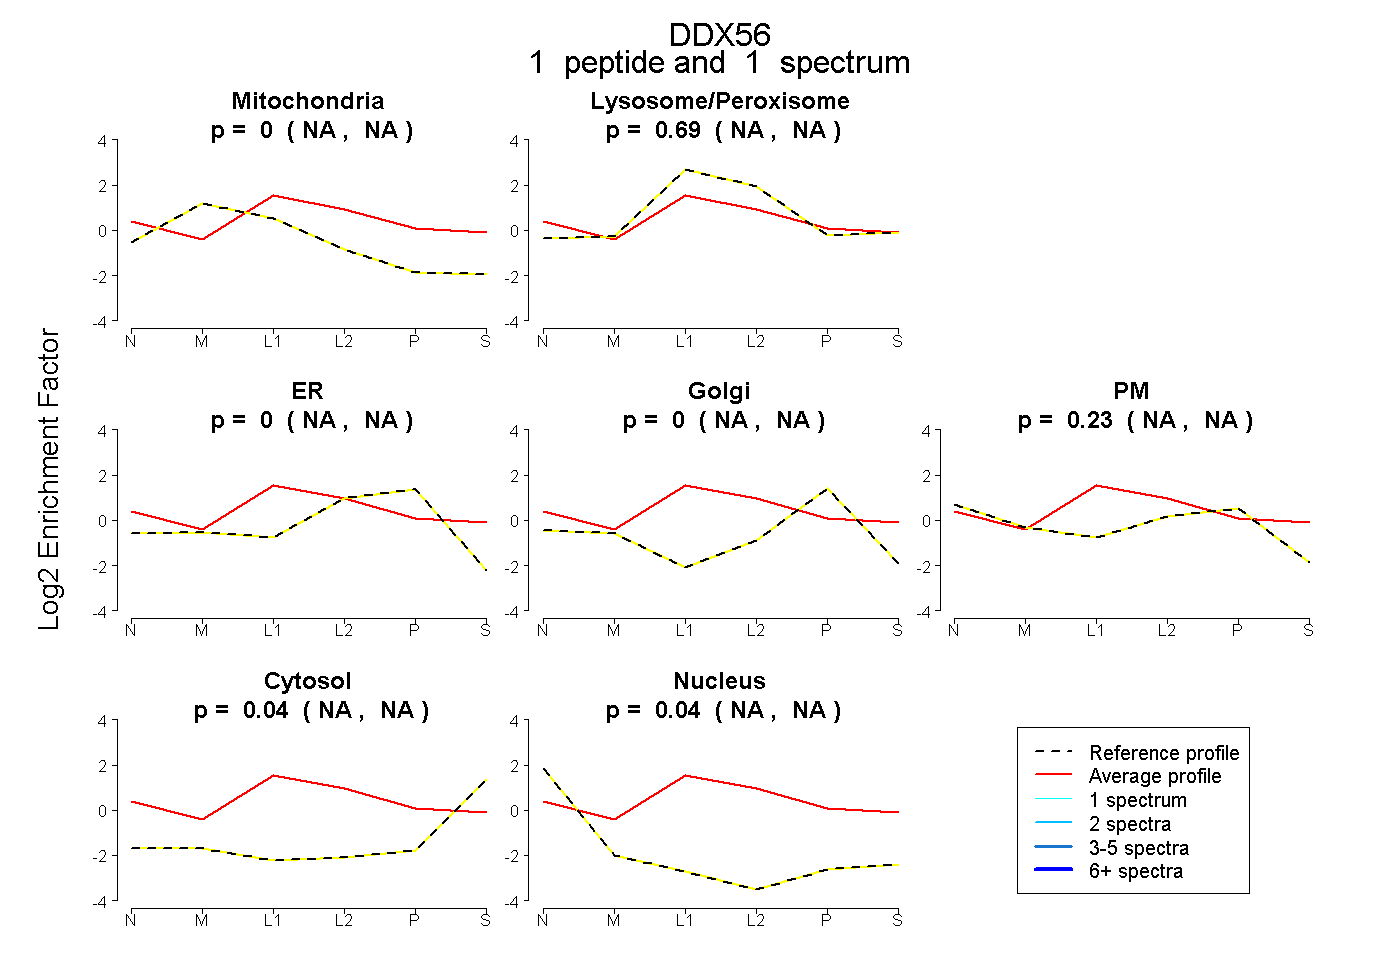 |
0.000 NA | NA |
0.687 NA | NA |
0.000 NA | NA |
0.000 NA | NA |
0.232 NA | NA |
0.041 NA | NA |
0.041 NA | NA |
|||
| Plot | Lyso | Other | |||||||||||
| Expt C |
2 peptides |
4 spectra |
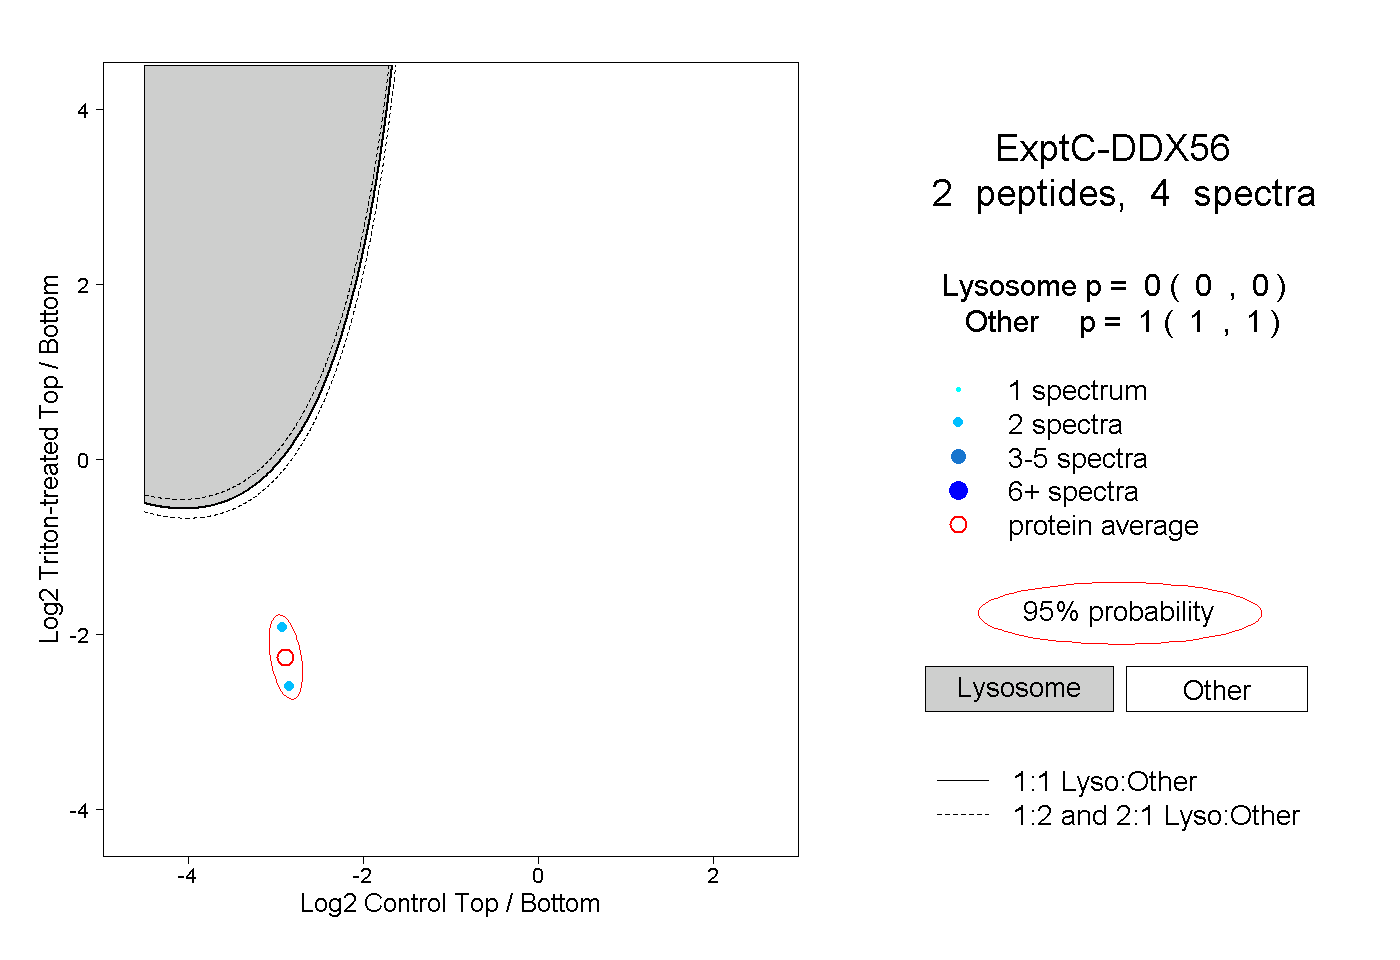 |
0.000 0.000 | 0.000 |
1.000 1.000 | 1.000 |