 2
2peptides
spectra
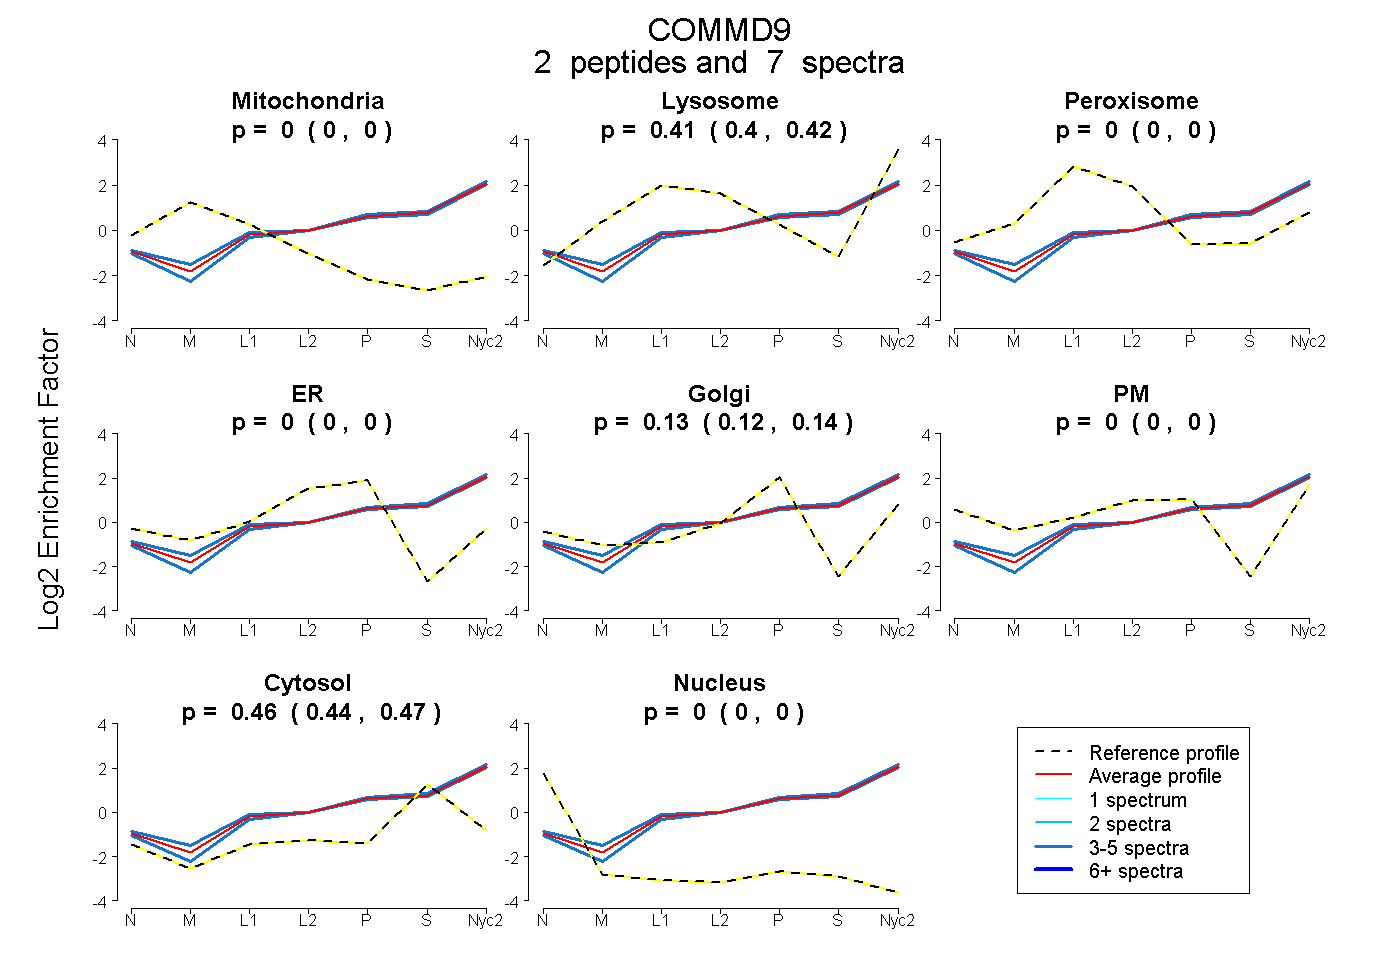
0.000 | 0.000
0.395 | 0.422
0.000 | 0.000
0.000 | 0.000
0.118 | 0.144
0.000 | 0.000
0.444 | 0.468
0.000 | 0.000
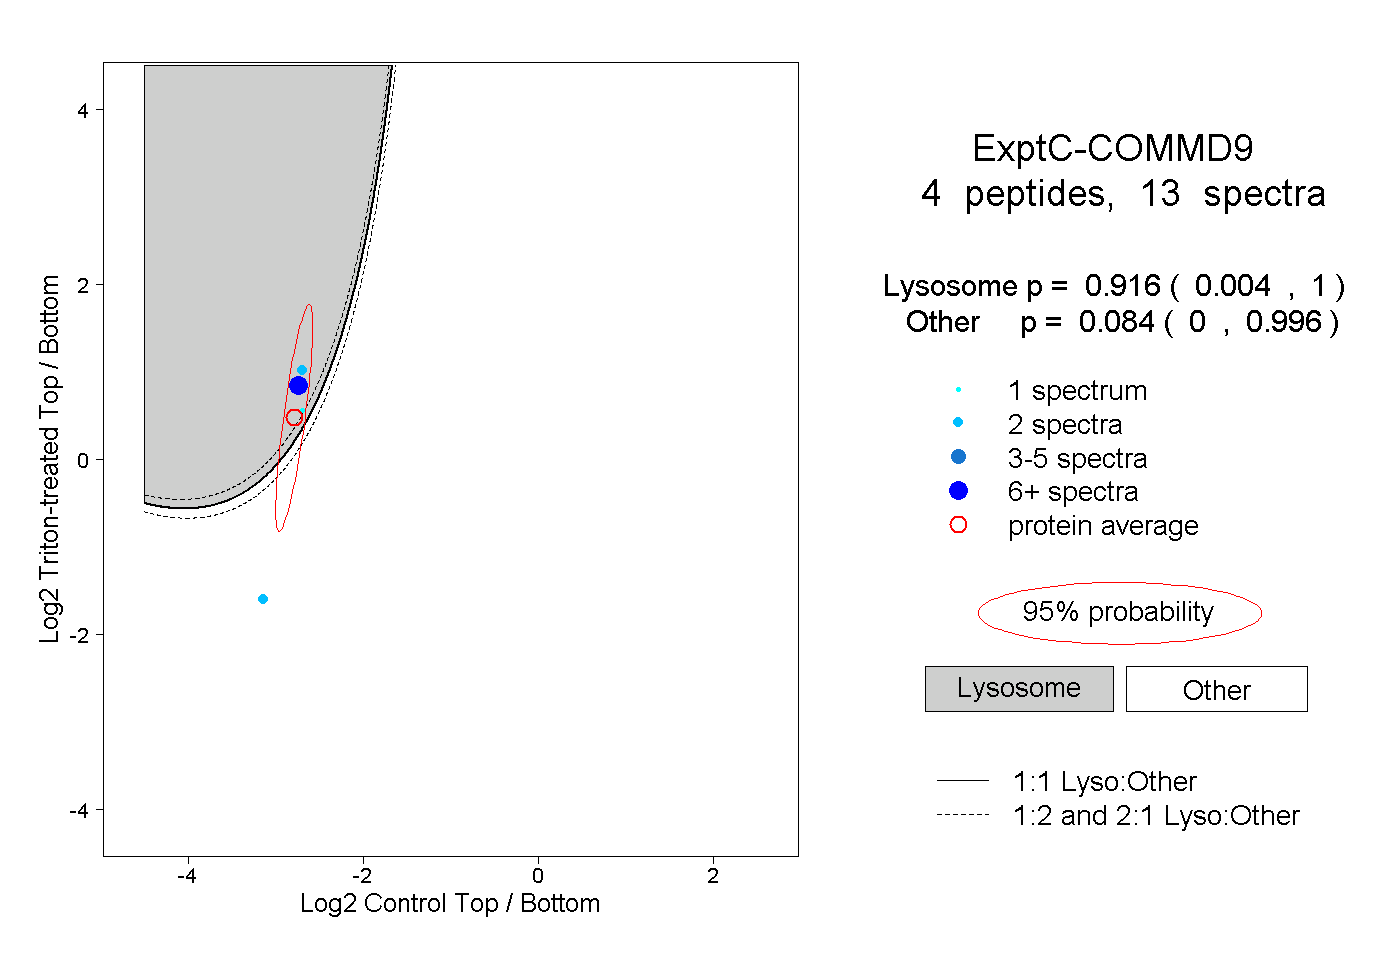
3peptides
spectra

0.000 | 0.000
0.256 | 0.670
0.000 | 0.395
0.000 | 0.159
0.000 | 0.000
0.160 | 0.320
0.000 | 0.000
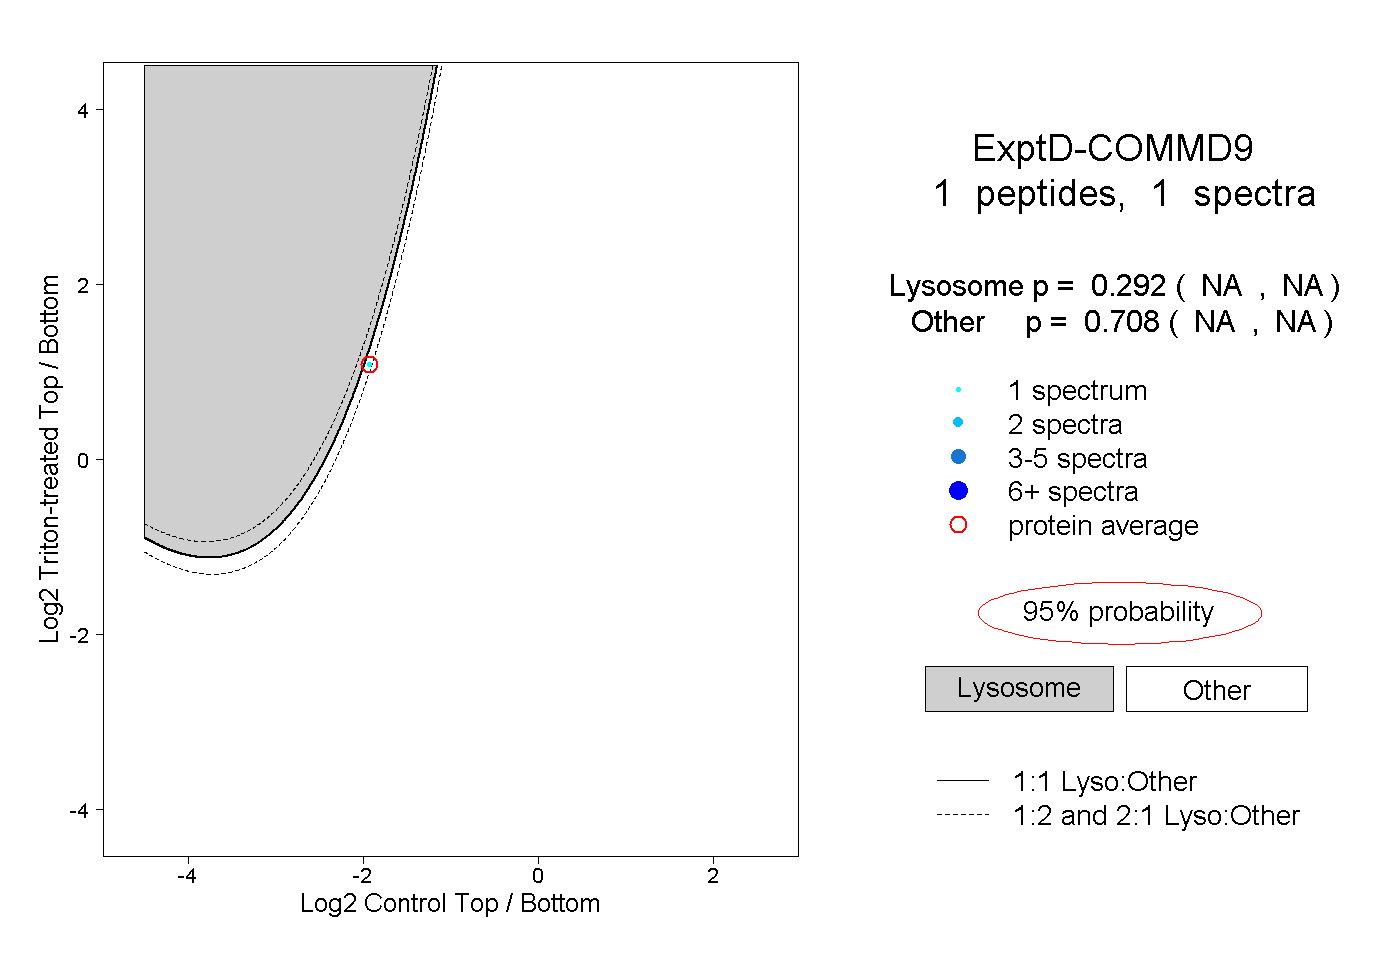
4peptides
spectra
0.004 | 1.000
0.000 | 0.996
1peptide
spectrum
NA | NA
NA | NA