 3
3peptides
spectra
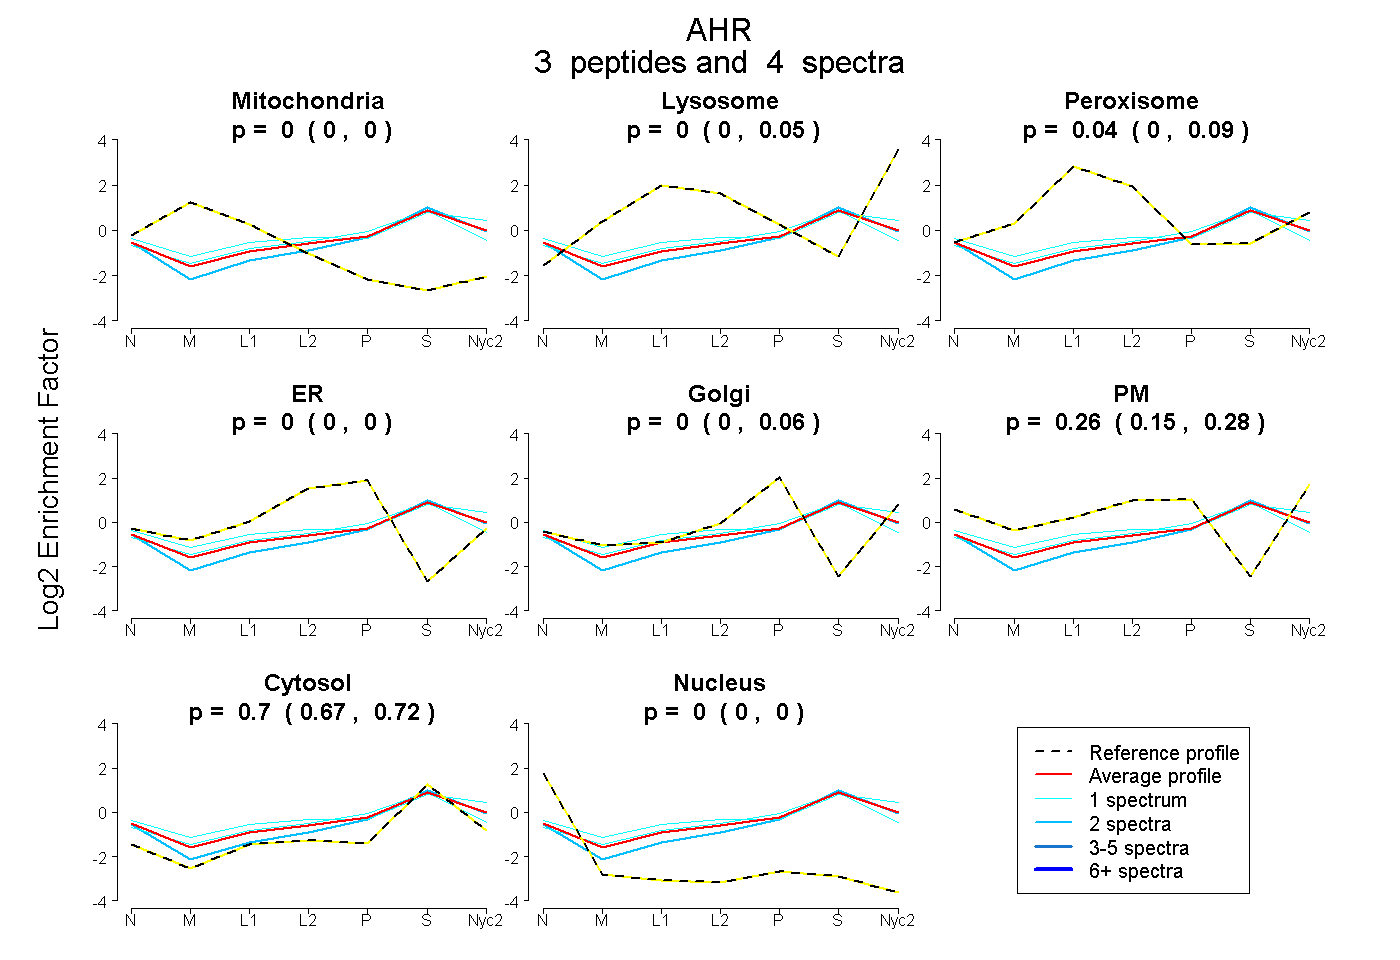
0.000 | 0.000
0.000 | 0.055
0.000 | 0.087
0.000 | 0.000
0.000 | 0.060
0.152 | 0.275
0.669 | 0.724
0.000 | 0.000
| Plot | Mito | Lyso | Perox | ER | Golgi | PM | Cytosol | Nucleus | |||||
| Expt A |
3 peptides |
4 spectra |
|
0.000 0.000 | 0.000 |
0.002 0.000 | 0.055 |
0.038 0.000 | 0.087 |
0.000 0.000 | 0.000 |
0.000 0.000 | 0.060 |
0.258 0.152 | 0.275 |
0.702 0.669 | 0.724 |
0.000 0.000 | 0.000 |
| 2 spectra, NLGIDFEDIR | 0.000 | 0.000 | 0.000 | 0.000 | 0.087 | 0.143 | 0.770 | 0.000 | ||
| 1 spectrum, SMQNEEFFR | 0.000 | 0.079 | 0.091 | 0.000 | 0.000 | 0.228 | 0.601 | 0.000 | ||
| 1 spectrum, WVQSNAR | 0.000 | 0.000 | 0.135 | 0.047 | 0.164 | 0.000 | 0.655 | 0.000 |
| Plot | Lyso | Other | |||||||||||
| Expt C |
1 peptide |
2 spectra |
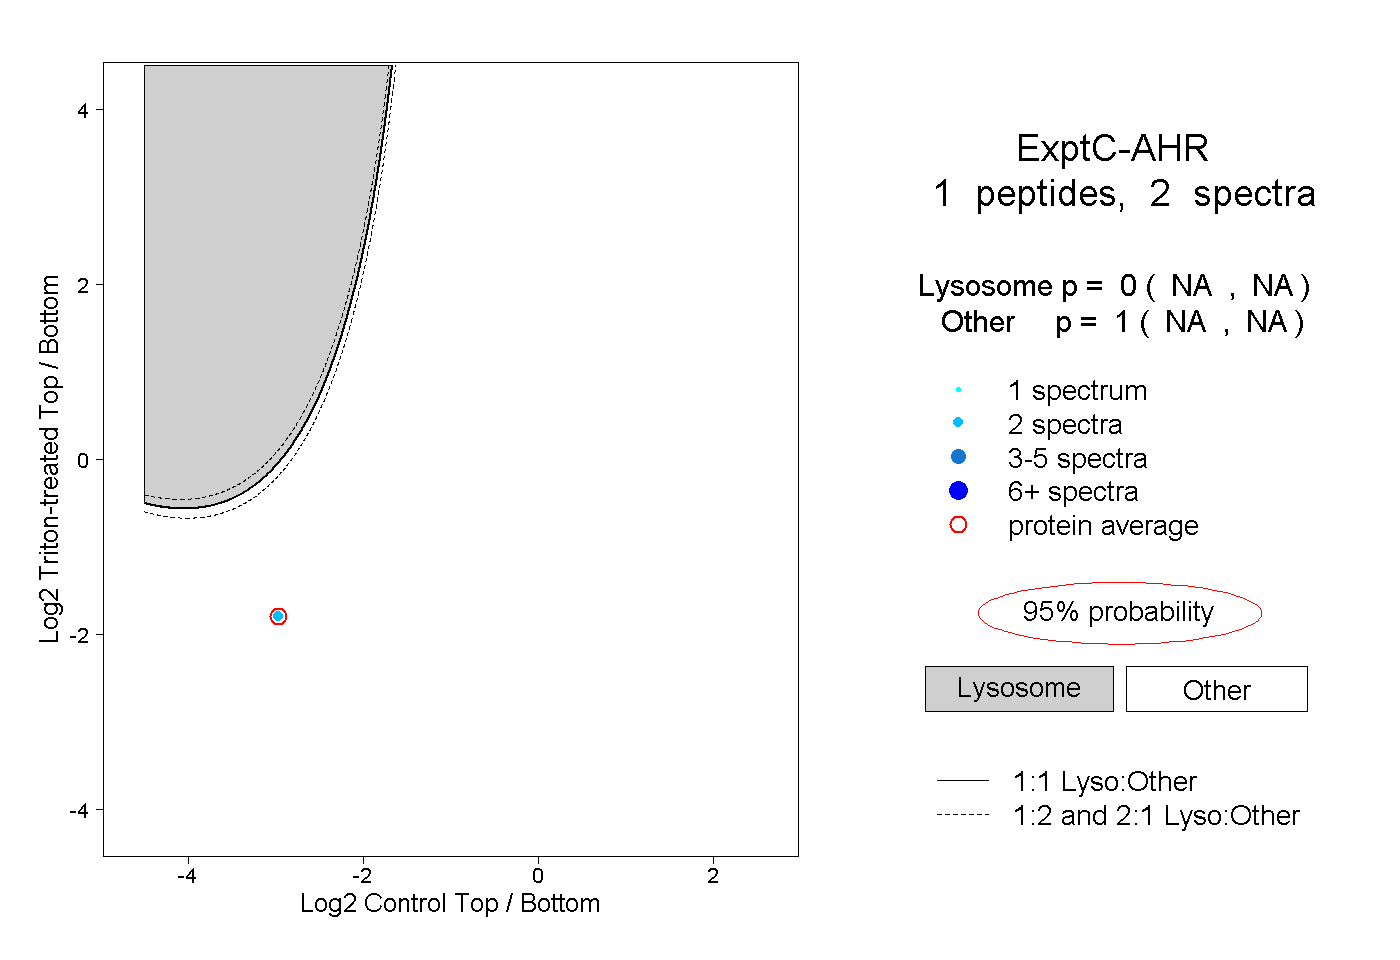 |
0.000 NA | NA |
1.000 NA | NA |