8
8peptides
spectra
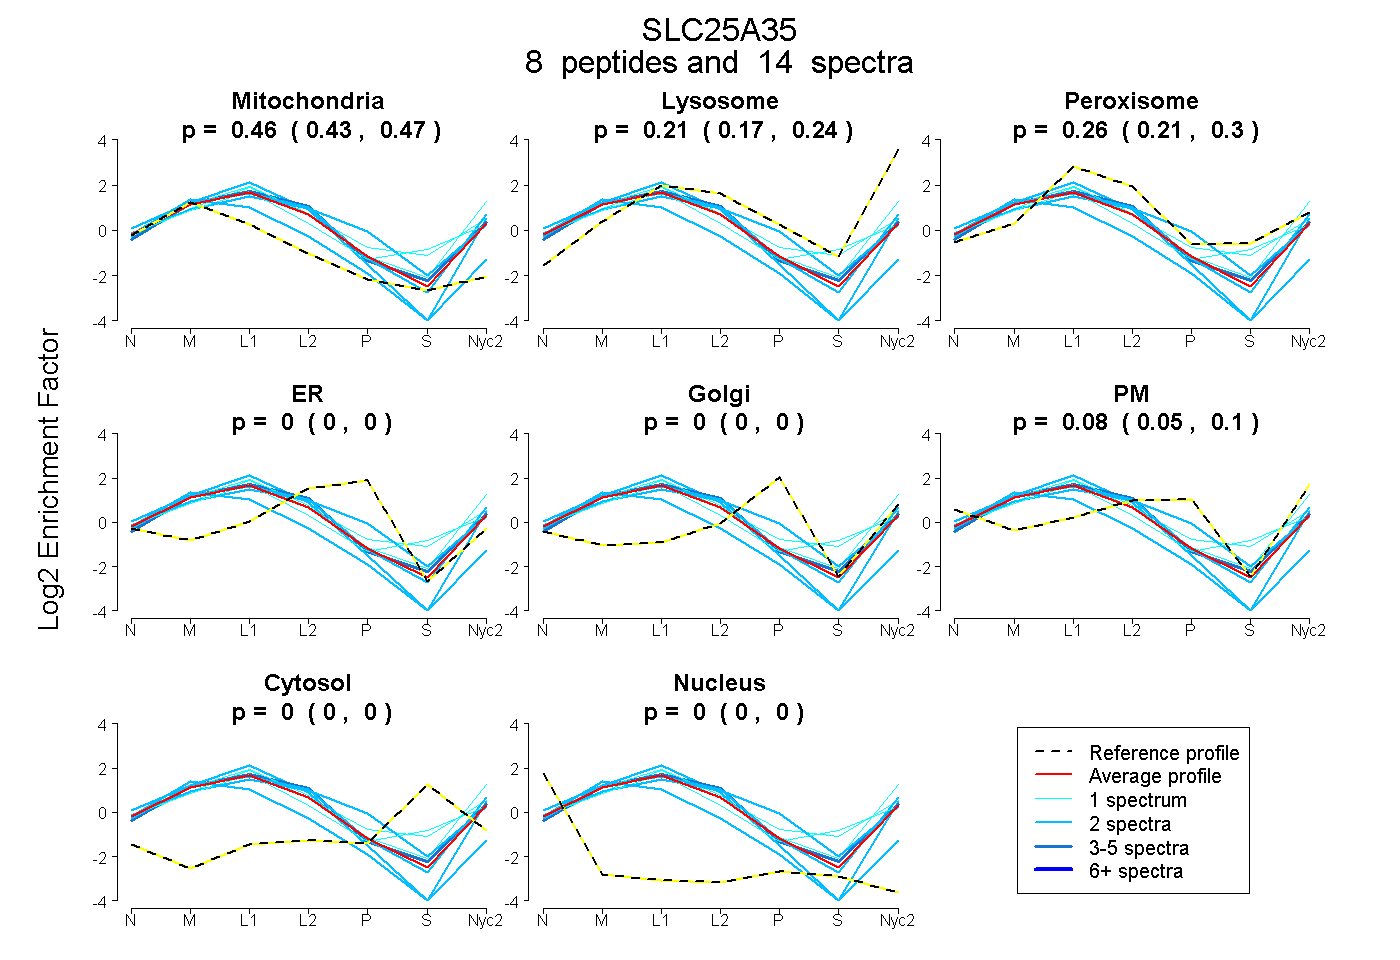
0.433 | 0.473
0.169 | 0.237
0.209 | 0.298
0.000 | 0.000
0.000 | 0.000
0.053 | 0.104
0.000 | 0.000
0.000 | 0.000
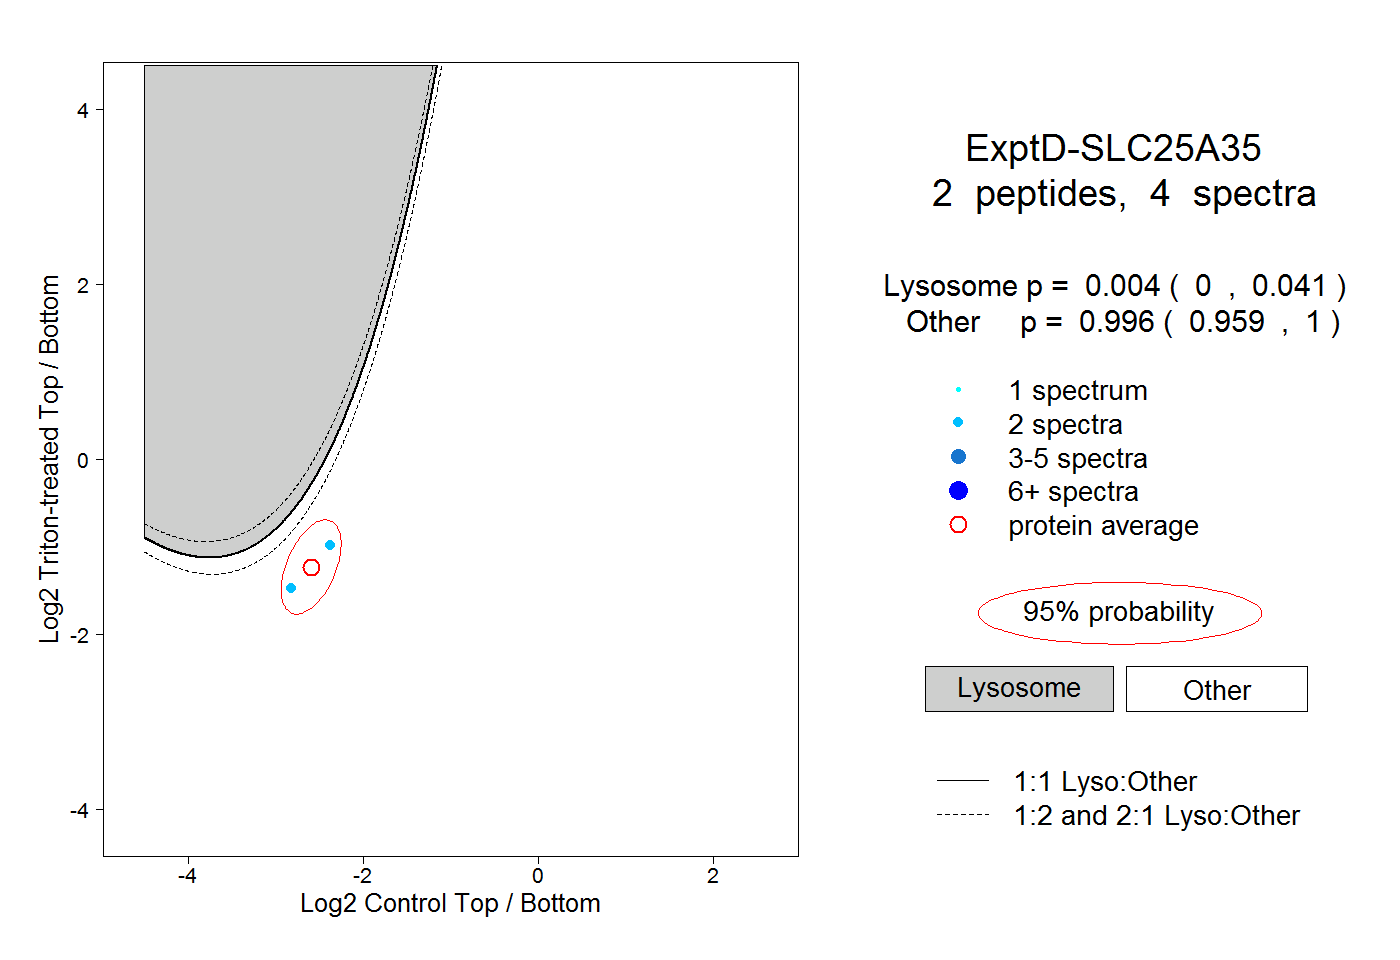
2peptides
spectra
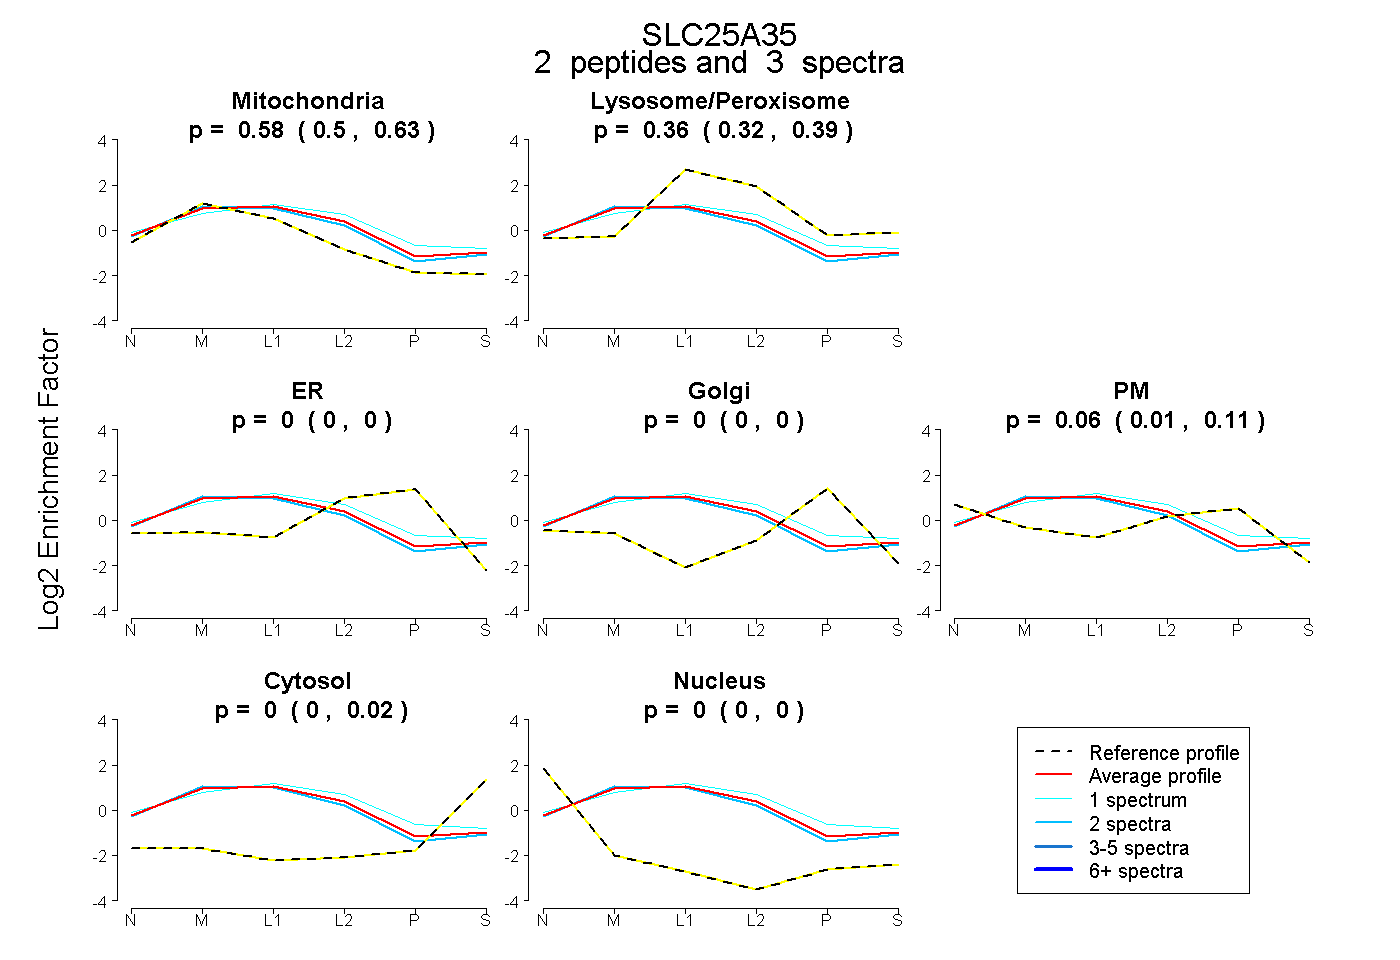
0.502 | 0.631
0.324 | 0.388
0.000 | 0.000
0.000 | 0.000
0.006 | 0.112
0.000 | 0.021
0.000 | 0.000
11peptides
spectra
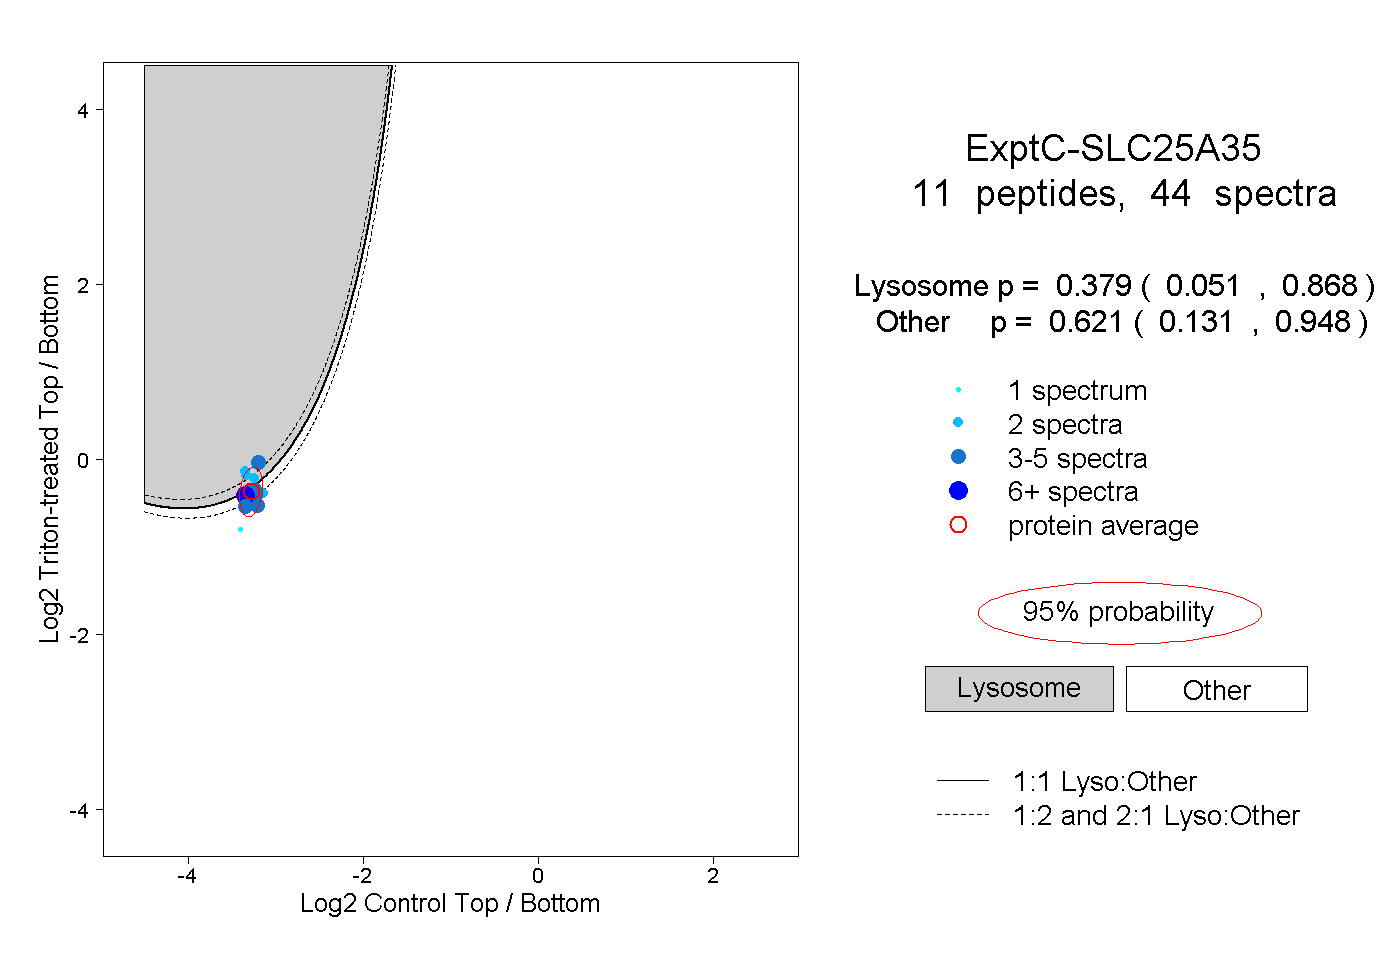
0.051 | 0.868
0.131 | 0.948